Models
In Slycat™, models combine analysis and visualization. Slycat™ provides three different types of models: Canonical Correlation Analysis (CCA), Parameter Space, and Time Series. The heart of every model is a data table. For each model type, there are predefined sets of linked views that provide different representations of the analysis results. Generally, the visualization for each model consists of three different representations, each showing the ensemble at a different level of abstraction. The highest-level view seeks to display the ensemble in a holistic manner. It seeks to show what high-level behaviors or trends can be seen across most, if not all, of the simulation runs. Slycat™ currently provides views showing correlations between inputs and outputs, or similarities between results. The intermediate-level view presents individually distinguishable runs in the context of the group, showing how well each member aligns with the high-level view of shared ensemble traits. The low-level view enables you to drill down to the raw data values, both to input parameters and to the results from individual runs.
Each model has a Name, a Marking, and an optional Description. Marking choices are defined as part of the server configuration, so they are specific to the institution that hosts the server. The intent is for Slycat™ to facilitate clear labeling of data sensitivity through explicit choice of marking. The marking appears as part of the model description on the Project page list, plus it is shown in both header and footer bars when visualizing the model.
Creating Models
Models are created by clicking the green Create button from within a project page and selecting one of the model types from the dropdown list. The information needed to create a model varies depending on which model you choose, so a popup dialog specific to the selected model will step you through entering the necessary information for that type (the details for each are covered below). Model creation can be aborted at any stage by clicking the X button in the upper right corner of the popup.
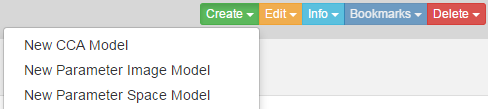
Figure 7: Create dropdown list of model choices, as seen from a project page.
Editing Models
Clicking on the yellow Edit button on a model page and selecting Name Model from the dropdown list allows you to change the model Name, Description, and Marking. A Name Model dialog will popup with the current model information. Click Save Changes to modify the model description on the server, or click the X button in the upper right of the popup to abort the operation.
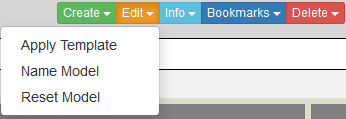
Figure 8: Edit dropdown list, as seen from a model page.
Reset Model
As you interact with a model and change various aspects of the visualization, Slycat™ keeps track of the current model state. If you leave that model and return to it later, Slycat™ will resume with the model rendered according to the most recent configuration state. Note that this is only true if you are returning to a model on the same computer using the same browser that you previously used to view it. However, sometimes you might want to start over with the default settings to produce the initial visualization. Clicking on the yellow Edit button on a model page and selecting Reset Model from dropdown list will return the model state to its initial configuration.
Deleting Models
To remove a model and ALL ITS DATA, click the red Delete button from within the model page of the model that you wish to delete. Select Delete Model from the dropdown. Model deletion is an irreversible operation, so deletion requires confirmation through a popup asking if you really want to delete that model. Press the red Delete Model button to confirm deletion, or click the X button in the upper right of the popup to abort the operation and keep the model.
View Regions
The inner part of each model’s visualization is subdivided into several views or regions, each separated from adjacent regions by a thick gray line. As you move the mouse over one of these region dividers, a double-headed arrow cursor perpendicular to the divider replaces the normal arrow cursor, the line extent (all but a darker gray center section) highlights in yellow, and the tooltip Resize pops up. If you click and drag the divider while this is enabled, the divider will move until you release it, resizing the regions on either side to reflect proportional changes created by the new divider location. The divider can be dragged to the very edge, effectively hiding the view.
Alternately, if you move the mouse over the darker center section of a divider, the center section highlights in yellow, the icon become a hand with a pointing finger, and the tooltip Close appears. Clicking the mouse button now will collapse one of the two adjacent regions. It collapses the region that is closer to the edge of the browser window. Clicking a second time on that same divider (now positioned along the edge of the model visualization) will restore the previous layout.
Download Data Table 
Since data tables are at the core of each model type, all models provide a table download operation. The download can take one of several forms: download the entire table, download only selected items, or download only visible items. As will be described later (see Selecting Points and Filtering), selection and filtering can be used to divide the data into sets using two approaches, either through highlighting or through visibility. Highlighting and visibility are independently defined sets, so selected items are not necessarily visible.
This functionality can be used to download a table or a table subset to your desktop, which can then be used to generate a new model. For example, if you had an ensemble where some of the runs failed to terminate properly, you could filter those runs out and download the subset of runs that finished correctly. Then you could use that subset to generate new models where the failed runs are not biasing the analysis results. Or alternately, you could download the subset that failed and use that table to create a Parameter Space model to explore what the failures have in common.
Color Themes
Color is used extensively in Slycat™ to encode information of various types. In the table views that appear within each model, green columns are associated with input variables, lavender designates output variables, and unspecified variables are not colored (they are rendered using an off-white).
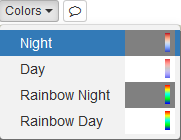
Figure 9: Dropdown list of color theme choices from the Colors button.
Slycat™ provides a set of predefined color themes, which are individually assigned to each model. A color theme consists of a bundled scatterplot background color and color palette for mapping numeric values to color-coded objects in Slycat™ views. Below the Navbar on the model page, there is an additional row of model-specific buttons. To change the current color theme, click the Colors button. As shown in Figure 9, there are four color themes available in the dropdown: Night, Day, Rainbow Night, and Rainbow Day. Night is the default choice. Night has a gray background and uses a diverging palette that maps low values to blue and high values to red, transitioning through white for values in the middle of the range [1]. Day has a white background and a similar blue to red mapping, though the palette is slightly shifted to transition through gray instead of white to enable you to distinguish points in the middle of the range from the background. Rainbow Night has a gray background and a conventional rainbow palette. Rainbow Day has a white background and a conventional rainbow palette. Although we provide Rainbow themes, we discourage their use since color order in the middle of the range is not intuitive.
Footnotes