Point Color
Similarly, there are two mechanisms for selecting the variable for color-coding individual points. Either select the variable in the Point Color dropdown list, or click on the variable name in the Variable Table column header. The two mechanisms are linked, so regardless of which one is used to make the choice, the selection is shown in both. The variable name is highlighted in the dropdown, and the backgrounds of that column’s elements in the table are color-coded to match the corresponding point’s color in the scatterplot. Once the selection is changed, the points are re-rendered using the new encoding and the legend is changed to reflect the name and value range for the new variable. In the image below, the points are color-coded by each car’s Horsepower value. Although the variable name is not fully visible in the table (we initially display each column at a uniform width, which tends to truncate many of the names), you can immediately tell which column has been selected for color-coding because the background coloring of the cells in that column makes it stand out.
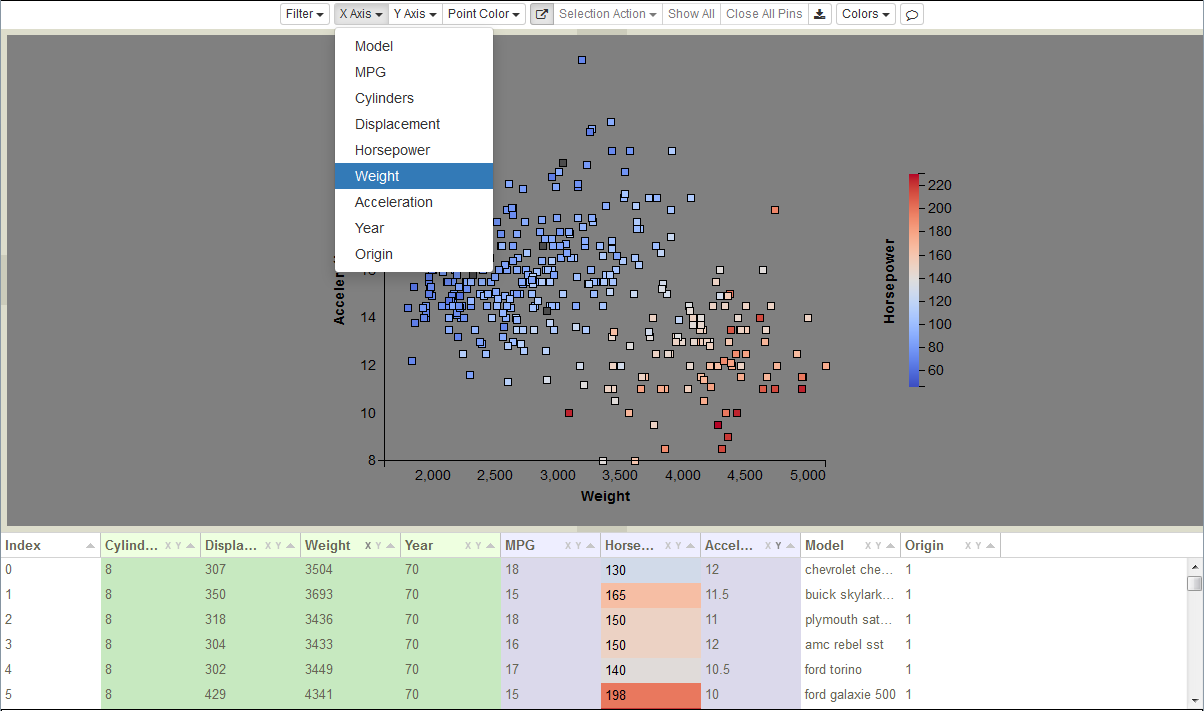
Points color-coded by Horsepower values.