Parameter Space Model Visualization
As shown below, the Parameter Space model page consists of linked scatterplot and data table views, combined with interactive filtering, data manipulation, and remote viewing of images and other media. The Scatterplot View provides an abstract representation of the ensemble members and their value distributions within the variables selected for the axes. The Variable Table provides the raw data values contained in the original table file. Changes made to the plot or the table will cause corresponding changes in the other.
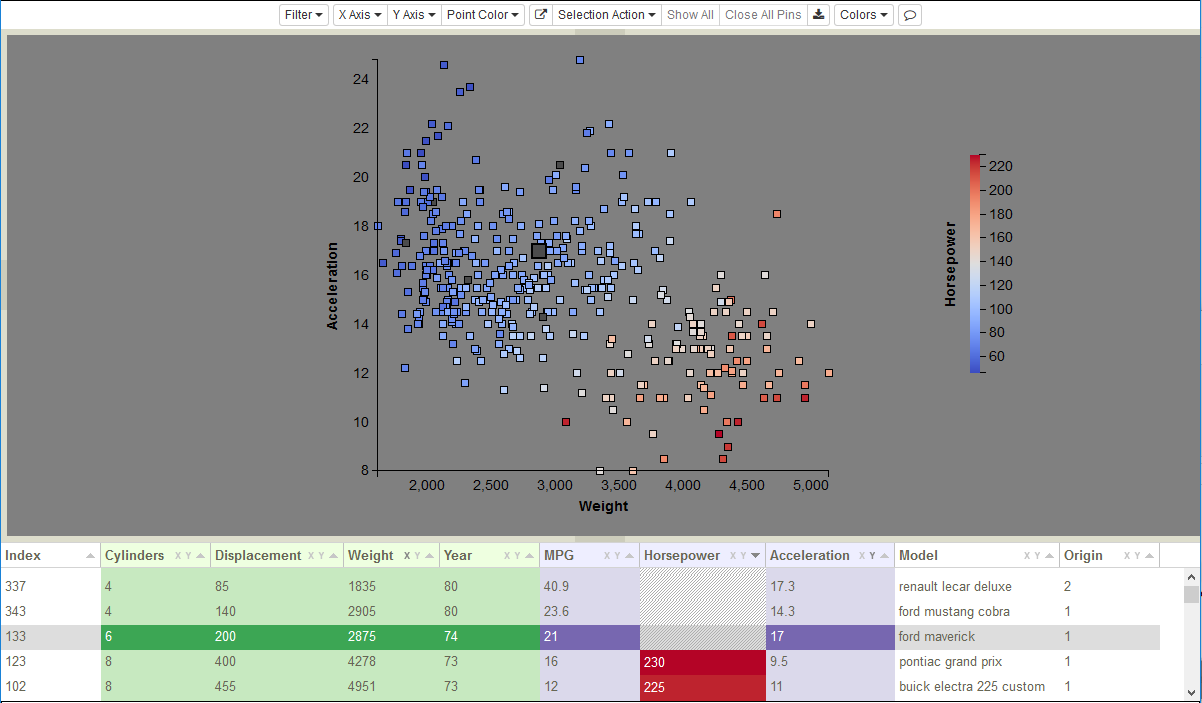
Parameter Space Model of cars data set with Scatterplot and Variable Table views, each providing a different level of abstraction.
As with the CCA Model Visualization example, we will be using the Cars data set in the following sections to illustrate some of the Parameter Space Model features. We will also be using the Taylor Anvil Impact Scenario (TAIS) ensemble, which includes image data, to demonstrate some of the media-based functionality.