Filtering
There are two mutually exclusive mechanisms in the Parameter Space scatterplot for removing points from the view, filtering and hiding selected points. Once a filter is present, point hiding operations in the Selection Action dropdown are disabled. If points had previously been hidden using point hiding, they immediately become visible again as soon as any filter is selected. This ensures that during filtering, visible points only reflect the filtering choices. We did this because we wanted screenshots of the model that included filters to be self-documenting as to which values were retained and which had been removed. This is useful for interpreting slides or figures outside of the Slycat™ interface.
However, sometimes manually removing points through selection is the only way to define a set of points matching criteria that are not achievable through filtering. Since multiple selections may be required to construct this set, we want to avoid discarding it unintentionally. Consequently, the last visibility state is saved when filters are enabled. Once all filters have been removed, the scatterplot returns to its previous state of visibility (i.e. any points that were previously hidden through the selection mechanism will return to being hidden). To explicitly return to a state of total point visibility, click the Show All button.
Similarly, filter states are saved, so if you remove a filter and then reinstate it, the filter will resume with its previous settings (button states or slider range). This way, if you accidentally remove a filter and don’t remember the settings, you can instantly restore your state.
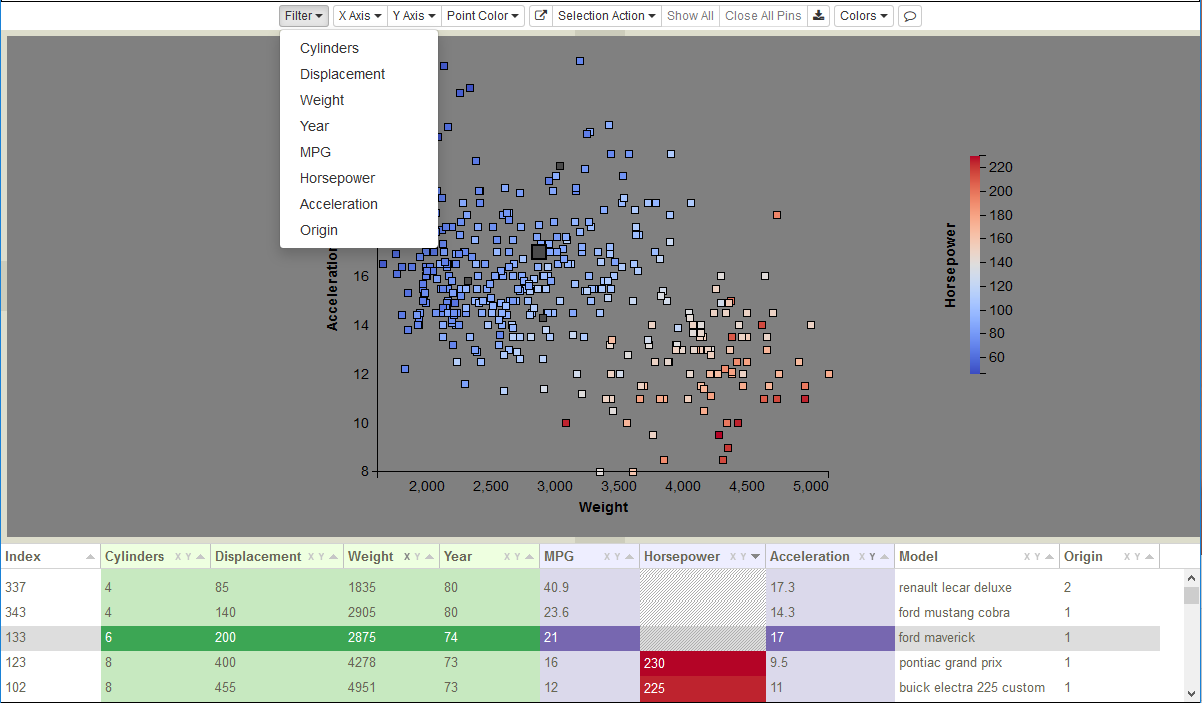
Figure 29: Filter dropdown variable list for cars data.
To add a filter, click on the Filter button to drop down a list of variables, such as those for the cars data shown in
Figure 29. Selecting a variable from the list displays a filter consisting of either a set of buttons for categorical variables
(see Creating a Parameter Space Model for how to define a categorical variable), or a slider for continuous variables (Figure 30
shows examples of each). To remove a filter, click the  icon in the upper left corner of the filter. In both types
of filters, blue coloration of the buttons or the slider range indicates values that are visible, whereas gray is used for
values that are not visible. As filters are changed to remove values, corresponding points are removed from the scatterplot and
their rows in the table are grayed out. Conversely, as filters add values back into the visible set, corresponding points will
reappear in the plot and their table rows will be re-colored.
icon in the upper left corner of the filter. In both types
of filters, blue coloration of the buttons or the slider range indicates values that are visible, whereas gray is used for
values that are not visible. As filters are changed to remove values, corresponding points are removed from the scatterplot and
their rows in the table are grayed out. Conversely, as filters add values back into the visible set, corresponding points will
reappear in the plot and their table rows will be re-colored.
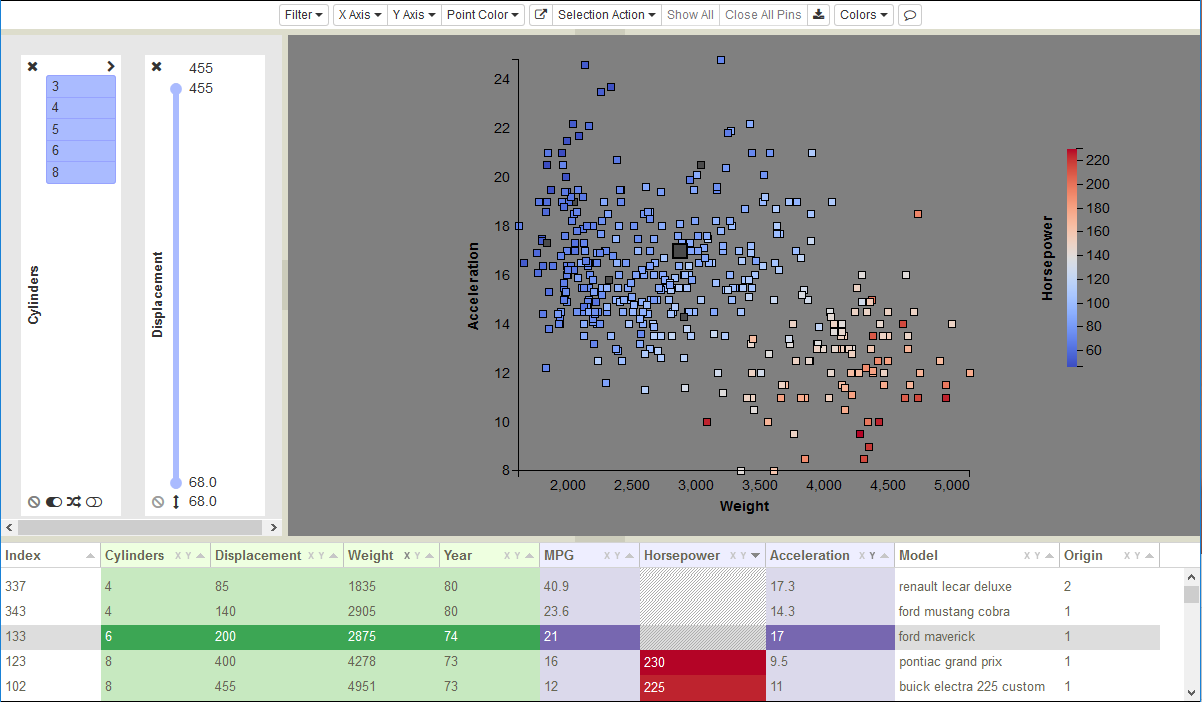
Figure 30: Examples of both a categorical and a continuous filter.