Continuous Filters
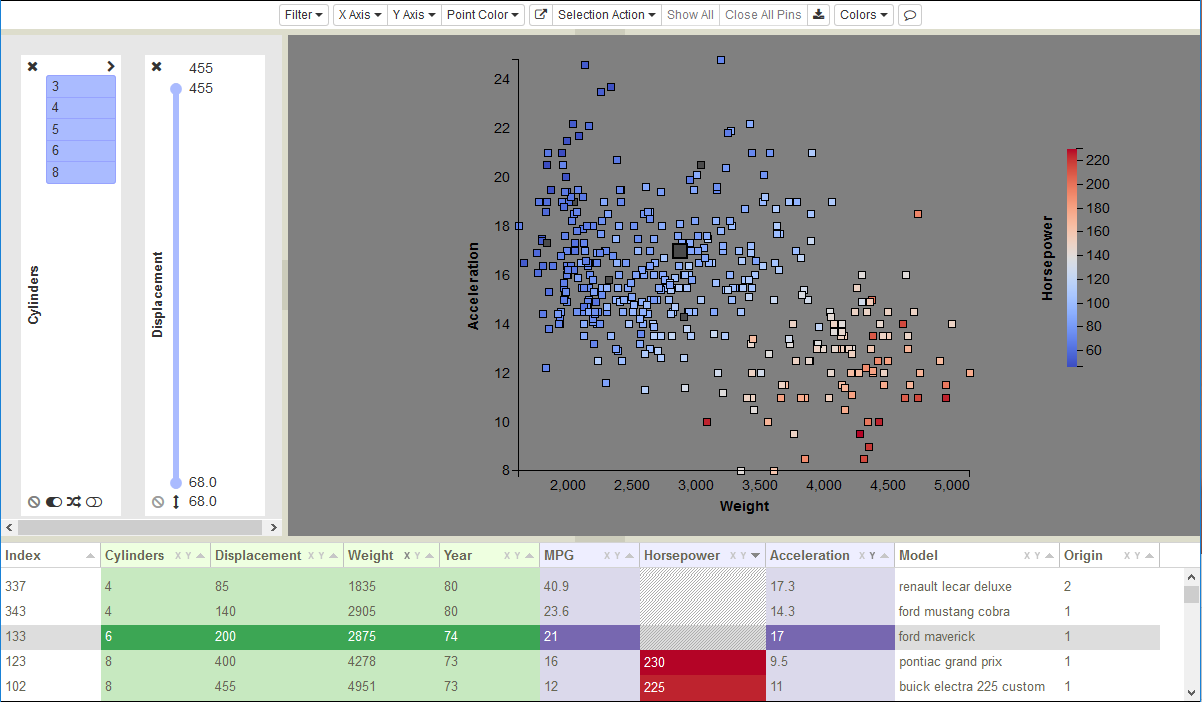
Figure 30: Entire variable range initially visible in slider.
The first time a filter is used, the entire range of the variable is visible (drawn in blue), as in Figure 30. The maximum and minimum variable values are at the top and the bottom of the filter, while the max/min values for the visible range are shown next to the slider endpoints. These max/min values interactively track the slider endpoints, changing both the value and position. The excluded portions of the range appear in gray, as demonstrated in Figure 31, where the maximum value has been dragged down to 268 and the minimum value has been pulled up to 166. In addition to grabbing and dragging the endpoints, you can drag the visible range as a unit, creating a sliding window of fixed length. The scatterplot and table are only redrawn when you stop moving the mouse or release the button.
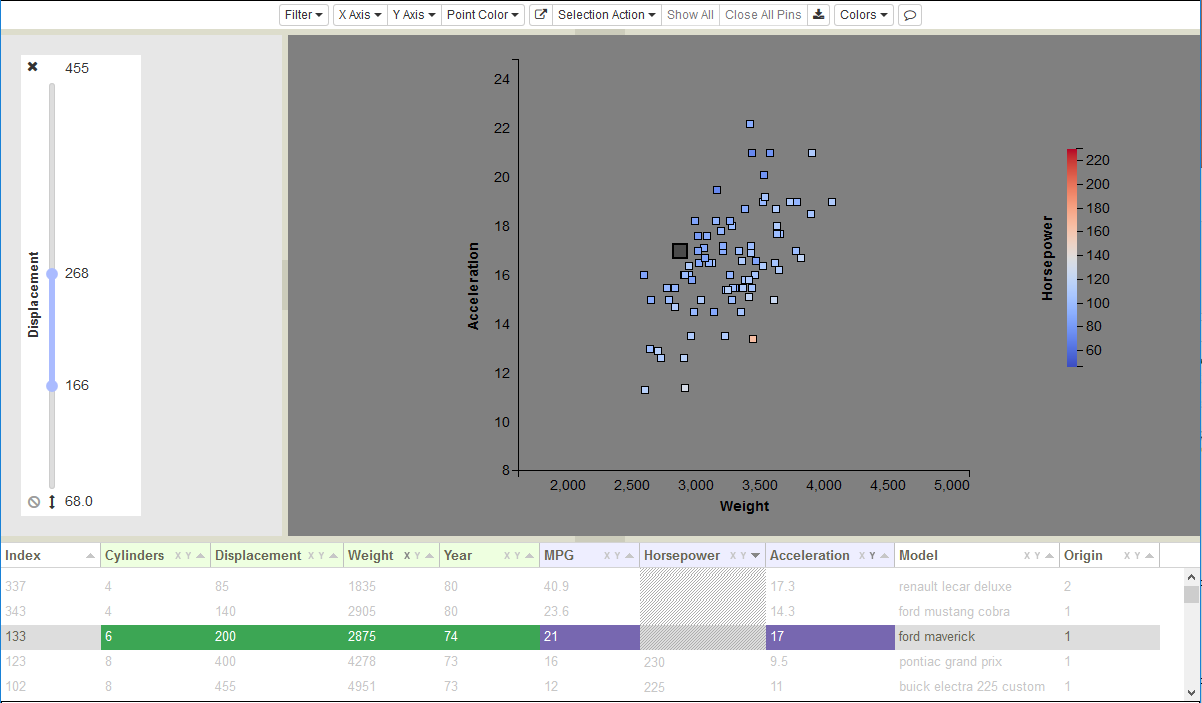
Figure 31: Slider after dragging adjusting Displacement max/min values.
Sometimes the resolution of slider increments can be a problem. The values associated with the set of unique slider positions may not include the value that you want to use as your threshold. So, the minimum and maximum threshold values are editable. To edit the threshold extrema, hover over the value (which will then turn orange as in Figure 32), type in the new value, and hit enter.
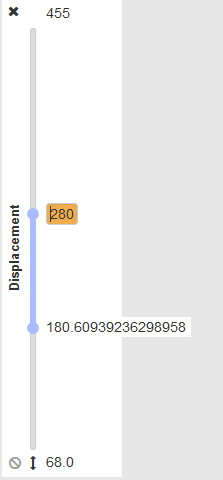
Figure 32: Editing a slider maximum threshold value.
On startup, the slider defines a single region of values that are visible. The  icon beneath the slider
indicates that this is the current mode of operation. Clicking on that icon inverts the mode, so values in the middle
region become hidden and values at the ends are visible. The icon changes to
icon beneath the slider
indicates that this is the current mode of operation. Clicking on that icon inverts the mode, so values in the middle
region become hidden and values at the ends are visible. The icon changes to  , the gray end regions become
blue, and the central blue region is drawn in gray. Figure 33 shows the result of inverting the Displacement slider
selection shown in Figure 31.
, the gray end regions become
blue, and the central blue region is drawn in gray. Figure 33 shows the result of inverting the Displacement slider
selection shown in Figure 31.
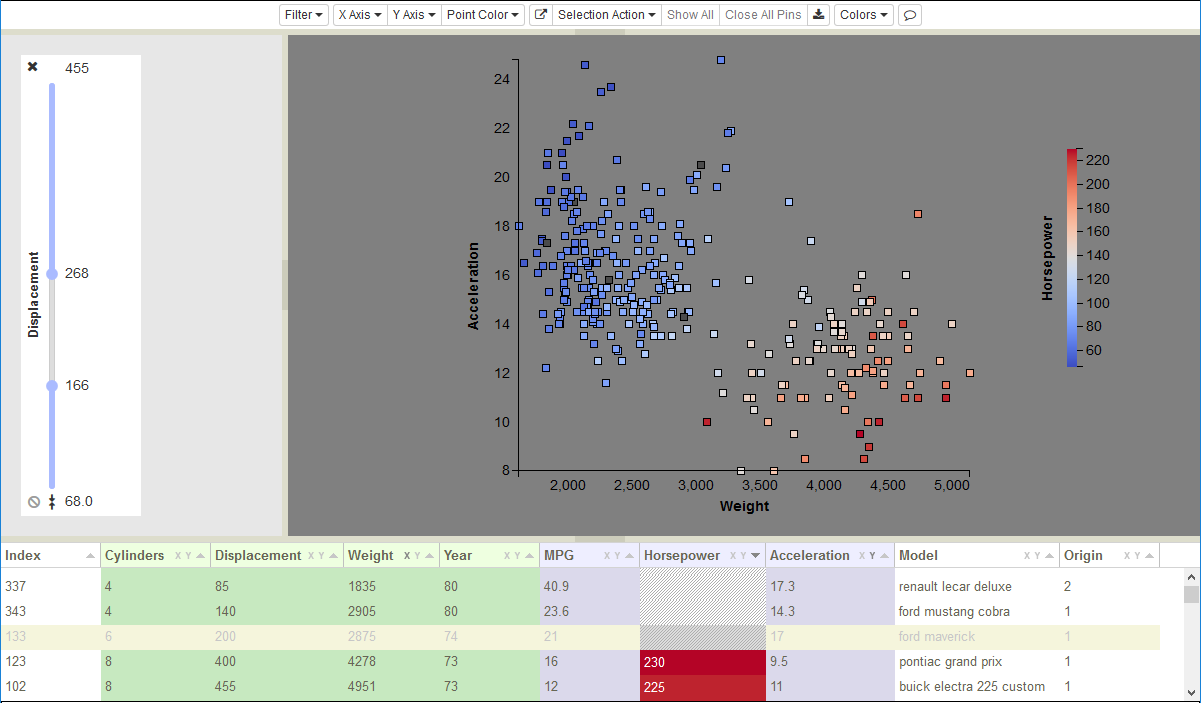
Figure 33: Invert slider selection to display only values outside the selected range.
Another type of problem arises when the slider range itself is skewed by anomalous values that are far outside of the normal
range for a variable (say points with values of 10,000, when the normal values are between 0 and 1). This forces most of the
slider’s value range to be empty, with all the points on the extreme ends. To eliminate this value bias, you can reset the
overall slider range by editing the maximum and/or minimum range values at the top or bottom of the slider. Values outside
of the revised range are hidden in the scatterplot and grayed out in the table. To edit the range extrema, hover over the
value (which will then turn orange), type in the new value, and hit enter. In Figure 34, we have reset the filter maximum
from 455 to 155. The maximum retains an orange background as a reminder that it has been modified. To reset the value back
to the original max/min, click the  icon.
icon.
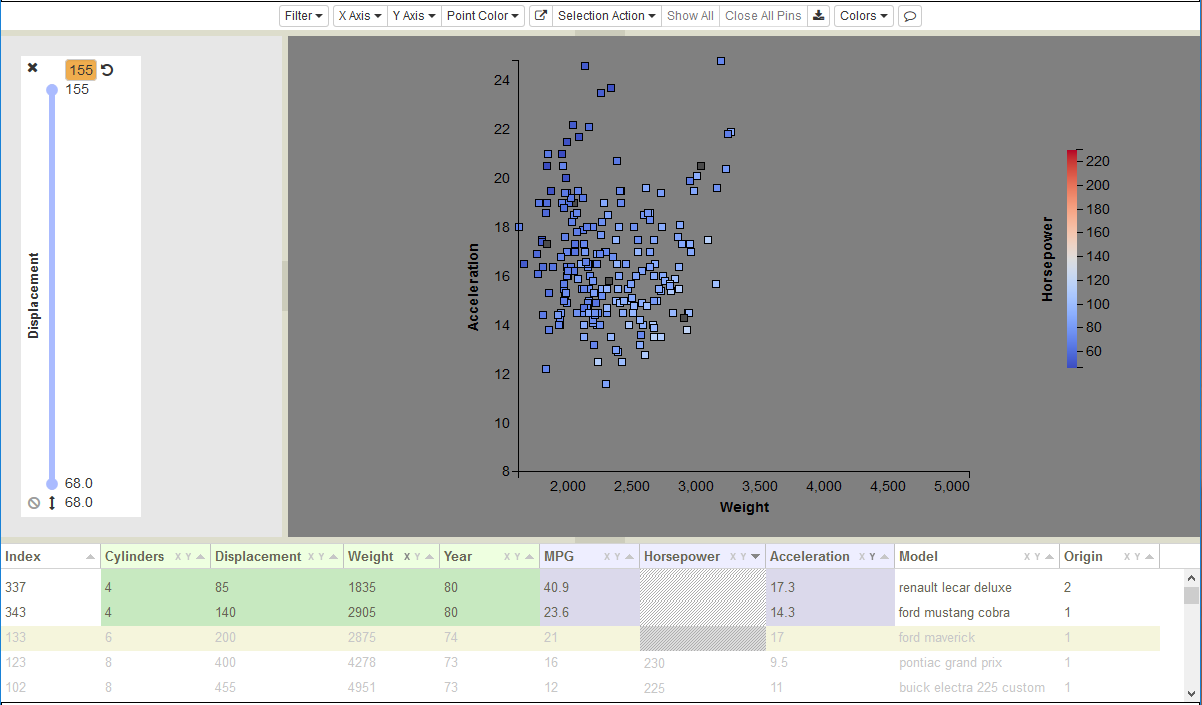
Figure 34: Resetting slider maximum to increase resolution within slider range.