Selection Action
Selected points (see Selecting Points) create a set that is used as the designated input for any of the group operations listed in the Selection Action dropdown, as shown in Figure 42. Since filtering and hide/show selections are mutually exclusive within the Slycat™ interface, if there are any filters enabled (visible), all of these actions, except Pin, will be disabled.
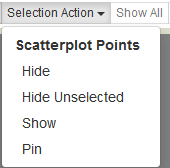
Figure 42: Selection Action dropdown list of operations on selected groups of points.
Hide removes the selected points from the scatterplot and yellows out the associated rows from the table. The points are still selected, but they are no longer visible, which is why their rows are colored yellow instead of white. If automatic scaling is enabled (see Automatic Scaling), the remaining visible points in the scatterplot will be shifted and recolored to reflect any changes in the value range.
Hide Unselected performs the same operation on the set of points that are not selected, thereby reducing the visible points to just the selected set.
Show restores the last hidden selection to visibility, both in the scatterplot and in the table. If the selection has been lost by clicking elsewhere within the scatterplot, Show will not be able to restore the previously hidden set, since the selected set is now empty. For the same reason, there is not a function to restore points hidden using Hide Unselected. However, the Show All button (to the right of the Selection Action dropdown) can be used to make all hidden points visible again.
Using the currently selected media variable, Pin retrieves and pins items for each of the points in the selection set (only if visible), performing the equivalent of a group hover and pin operation. This is much more efficient than doing individual retrieval when there are large numbers of runs to compare. Note that the images may be stacked on top of one another if the associated points are coincident, as is the case in Figure 43. However, you can separate the images by dragging them apart, as shown in Figure 44.
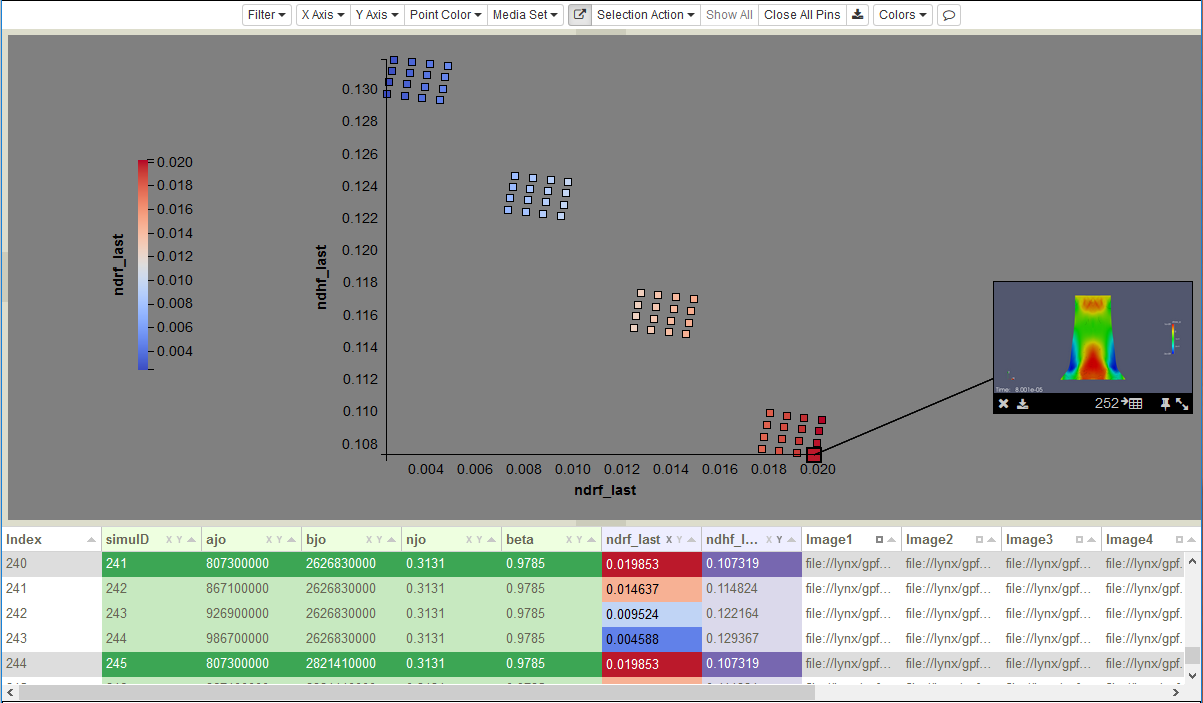
Figure 43: Four selected runs are coincident in the scatterplot, so the associated pinned images are stacked.
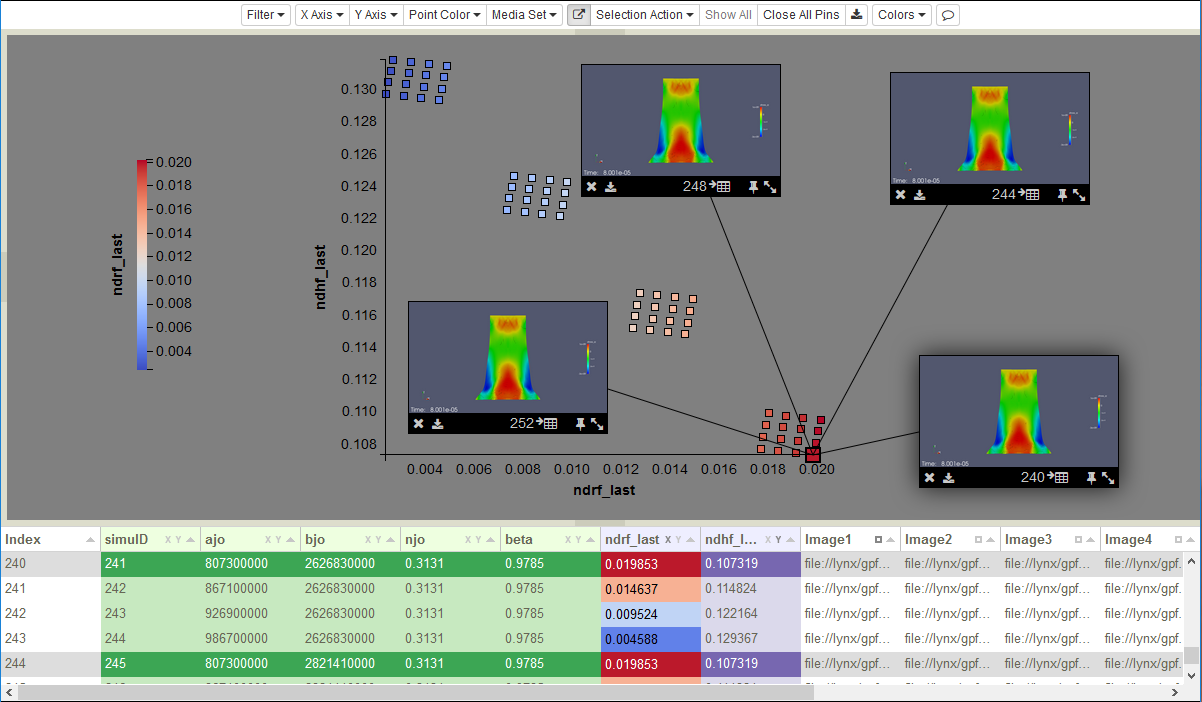
Figure 44: Separating pinned images by dragging. Note that the legend can also be repositioned by dragging.