Select Columns
Once the table has been read, either from a Local or a Remote source, the Select Columns page displays a list of the table’s variable (column) names and asks you to categorize them as Input, Output, or Neither for the CCA analysis. Variables marked as Neither are omitted from the analysis altogether. Since CCA requires numeric values, strings are automatically excluded from consideration.
Looking at the variables in our Cars example in Figure 19, the faded variable name at the top of the list, Model, is the name for each car model. Because its values are all strings, it has been automatically set to Neither and cannot be changed. Although Origin is a numeric variable, the numbers are encoding categorical labels whose value order has no meaning (US = 1, Europe = 2, Asia =3). Because the values have no ordinal interpretation, Origin should also be removed from the analysis.
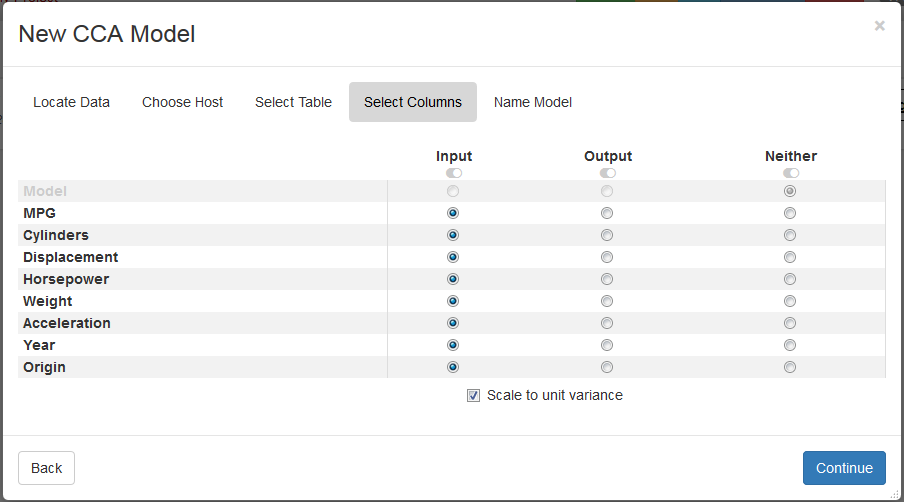
Figure 19: Initial configuration in the Select Columns dialog for the cars data set.
Since the number of inputs typically exceeds the number of outputs, we initialize all numeric variables to be inputs, leaving you to identify just the output and excluded variables. If variables shown for this table don’t correspond to the ones you wanted or expected, you can click the Back button to select a different table file.
Variables can be marked one at a time by clicking the radio buttons, or they can be marked in larger groups by using either
shift-click to select a contiguous group of variables, or by using control-click to pick a scattered set of rows (as
demonstrated in Figure 20). For group selections, you must click on the rows near the variable names instead of near the
radio buttons. Once you have highlighted a set of lines for joint assignment, click on the  icon under the desired
category to set the radio buttons for the group, as shown in Figure 21. Since CCA can be performed on any subset of variables,
you can also use it to calculate correlations between multiple inputs and a single output, or between any two individual
variables.
icon under the desired
category to set the radio buttons for the group, as shown in Figure 21. Since CCA can be performed on any subset of variables,
you can also use it to calculate correlations between multiple inputs and a single output, or between any two individual
variables.
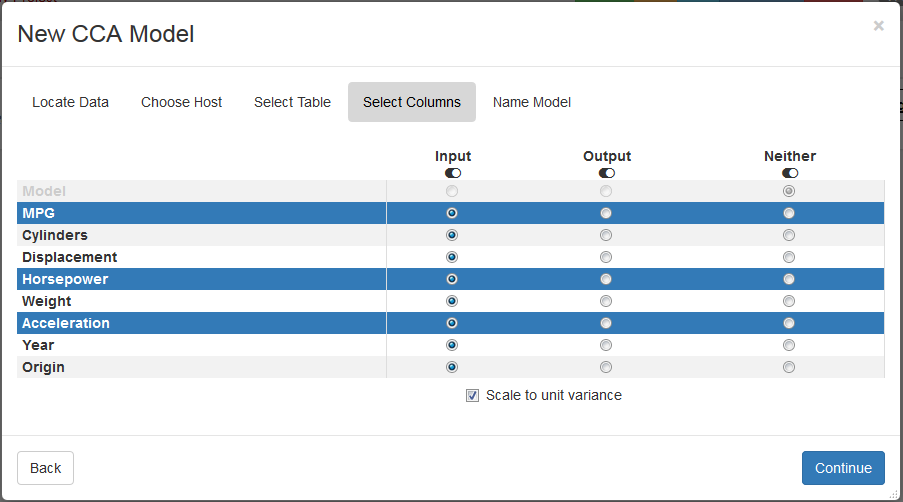
Figure 20: Click on the icon beneath Output to label the highlighted variables as outputs.
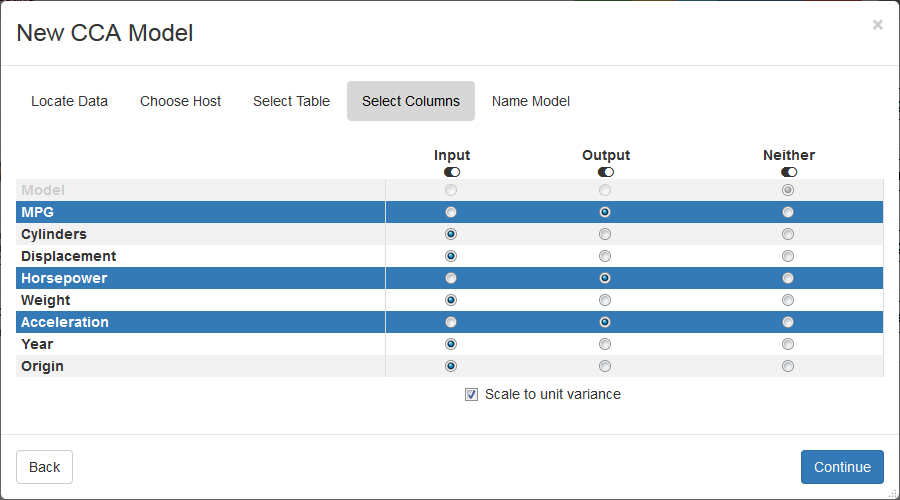
Figure 21: Result of using shift-click and the group assignment icon to select Output variables.
Sometimes value ranges between variables differ by many orders of magnitude, which can bias the analysis. The checkbox, Scale inputs to unit variance, permits you to normalize the values prior to running CCA. This feature is enabled by default. If you wish to perform the analysis using the original unscaled values, click within the box to remove the checkmark.
Once you have finished defining the input/output variables for the CCA analysis and have determined whether you want the values to be scaled, click Continue to go to the final step where you provide a name for your model.