CCA Model Visualization
As shown below, visualization of a CCA model consists of three linked views, each providing a different level of abstraction. The most abstract level is the Correlation View, where each column displays the structure coefficients for one of the canonical components. The scatterplot in the Simulation View shows how well each individual run is described by the correlations found in the ensemble overall. The least abstract view is the Variable Table, which provides the raw data values contained in the original table file. The views are all linked, so changing the selection in one view will modify the selection in one or more of the other views. As with most Slycat™ models, the views are arranged with the ensemble level view in the upper left, the midrange view in the upper right, and the lowest level view at the bottom.
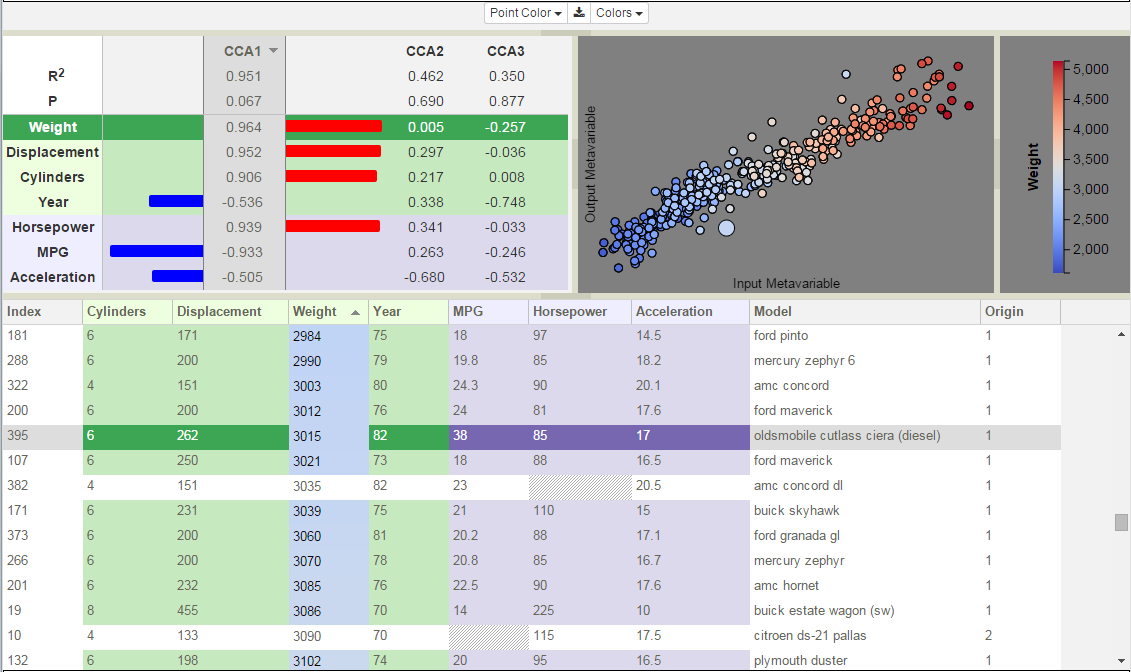
CCA model of cars data set with three linked views, each providing a different level of abstraction. The Correlation View is in the upper left, the Simulation View and its associated Legend are in the upper right, and the Variable Table fills the bottom half.