Variable Table
The Variable Table at the bottom of Figure 23 provides access to the original numeric variable values for each simulation run. It is essentially an interactive version of the original table data, where each column represents a single variable and each row contains the variable values for a single ensemble member. Within the table, the cell backgrounds take on one of four color-encodings: input variables are green, outputs are lavender, non-designated variables are white, and the elements of the selected variable are individually colored by their value using the current color map (see Color Themes). Coloring table elements by value highlights the selected color-coding variable, while concurrently providing color correspondence between rows and scatterplot points. The interactive capabilities of the table include: sorting within columns, column (variable) selection, and row (simulation) selection.
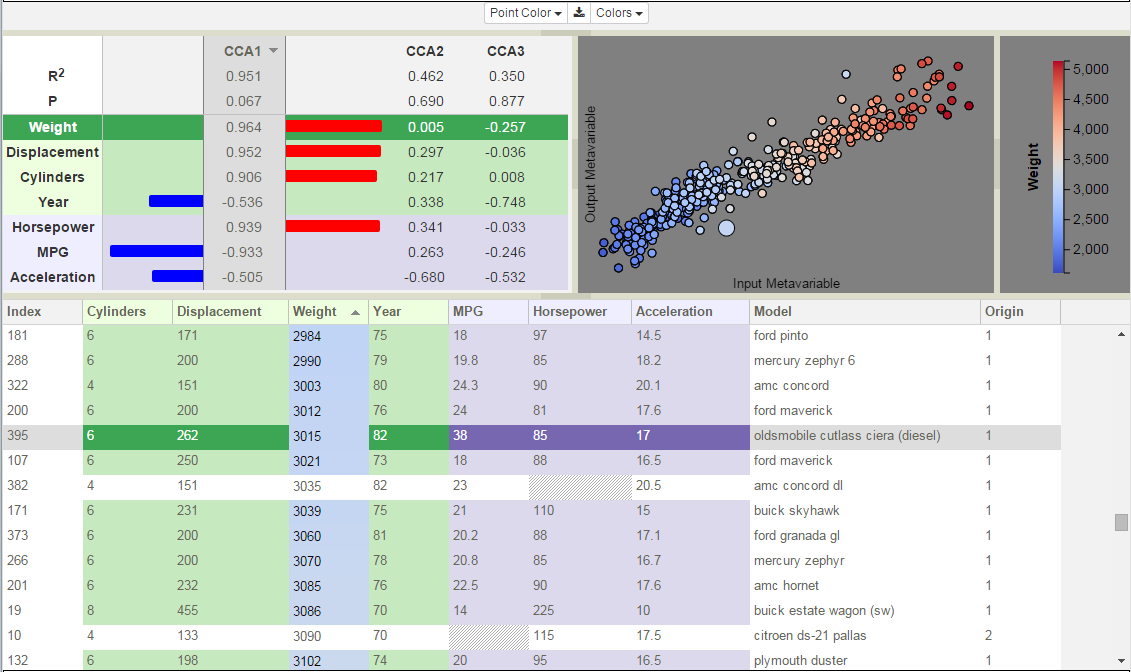
Figure 23: CCA model of cars data set displaying the first canonical component.
Rows that have not been used in the CCA analysis have white backgrounds. CCA requires that all rows have values for each of the columns that are included in the analysis. As shown in Figure 24, the cars in rows 382 and 10 are missing values for Horsepower and MPG, respectively. The missing data are shown with no numeric value and a hatched gray background in the table. Since the columns with missing values were declared as outputs during model creation, rows 382 and 10 have been entirely excluded from the analysis and are drawn in white. If CCA is later rerun, and if Horsepower and MPG are removed from the analysis (if the columns are marked as Neither when creating the new model), then these rows will be included in the calculation and will be color-coded.
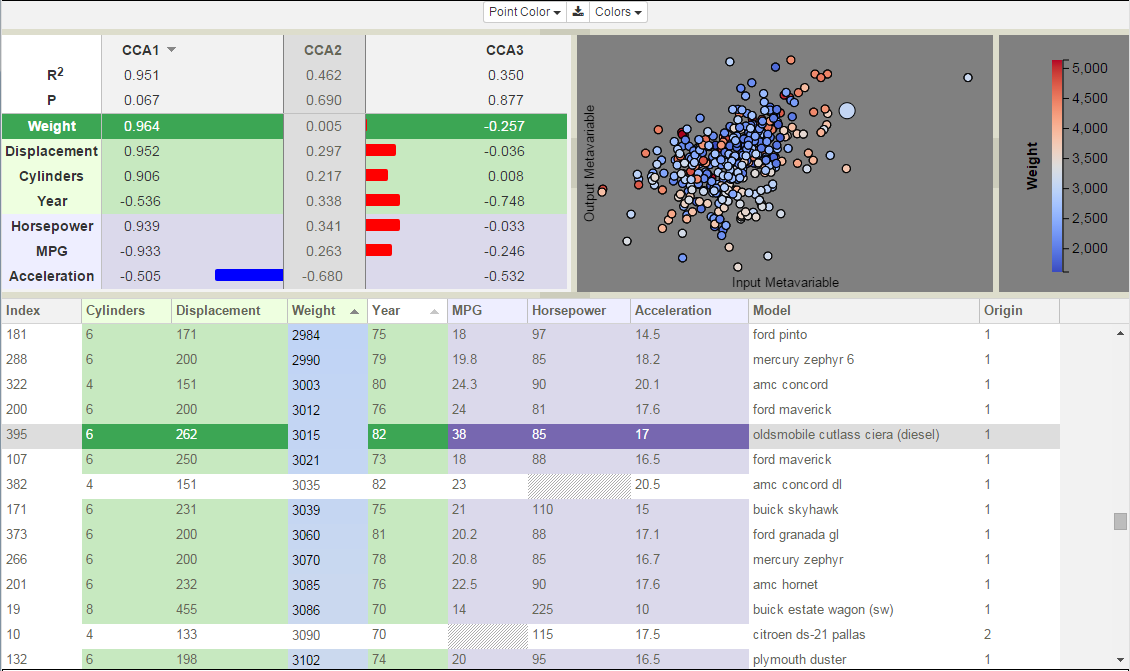
Figure 24: CCA model of Cars data set displaying the second canonical component.
Sorting
Sorting allows rapid identification of simulations whose variable values are extrema. Additionally, sorting facilitates comparison between simulations whose values are similar within one variable, but whose values for other variables might differ significantly. For instance, in Figure 23 and Figure 24 the tables are sorted by weight. The highlighted row appears adjacent to cars having similar weights, yet the selected car is notable because it gets much better gas mileage.
Although the sorting order is defined by values within a single column, the full row moves in the reordering. To sort on a variable, left-click the small triangular icon in the column header. The initial sort is ascending and the orientation of the triangle reflects this by rendering the triangle with the tip at the top and the wide edge at the bottom. If you click the triangle again, the sorting order is reversed to be descending and the triangle is redrawn with the point at the bottom. The sorting column is independent of variable selection (see Color-Coding Points). Hovering over any of the column headers, the sorting icon for that column becomes visible and may be clicked to initiate sorting on that variable.
Variable Selection
Left-clicking the variable name in a column header selects that variable to color-code the scatterplot points in the Simulation View, to color the cell backgrounds in its associated table column, and to highlight that variable’s row in the Correlation View.
Simulation Selection
Left-clicking within a table row selects that simulation, which is then highlighted in both the table and the scatterplot. Multiple row selection, as is commonly performed on lists, consists of clicking on a starting row, then using shift-click to select the ending row (either above or below the starting row). This selects both the starting and ending rows along with all rows in between. Individual rows may be added to an existing selection by clicking on them while pressing the control-key. Selected rows are highlighted in the table by increasing the saturation of cell backgrounds, except for cells in the color-coding column (see Variable Table). Selected scatterplot points are highlighted by being redrawn with an increased radius.