Loading Data and Progress Indicators
At this point, the wizard will return to the Locate Data tab where you selected the input files and provide a progress indicator for each of the uploads. For instance, if you selected a single DAC Generic Zip file, the progress indicator would look like the one shown in Figure 12. At this point you must wait for the selected file(s) to upload before closing the browser. If you close the browser, the file upload will be terminated and no data will be uploaded to the model.

Figure 12: Uploading data in DAC model creation wizard.
Once the data is uploaded, the wizard provides a different progress indicator, as shown in Figure 13, to reflect the progress in processing the data set and the creation of the final model. If there are any error messages, they will appear in the space below the progress bar. If the error messages exceed the available space in the box, they will automatically scroll. To facilitate reading the error messages before they scroll out of sight, you may click within the text box to alternatively pause and restart scrolling. It is safe to close the browser during the model upload screen. For very large models, you can leave and return later. When you re-open the browser it will show progress or present the finished model.

Figure 13: Data processing and model creation progress indicator.
During the processing phase, DAC will parse files and upload data to the model. For the DAC Generic Format, distance matrices are provided and uploaded directly. For PTS and TDMS data, DAC creates distance matrices quantifying time series similarity by doing an all-to-all comparison between the ensemble members. The distances in these matrices are then input to a weighted Multi-Dimensional Scaling (MDS) algorithm that projects each of the ensemble members into a two-dimensional space. Proximity of projected points indicates similarity between those samples.
Each variable’s contribution (weighting) in calculating point projections can be interactively adjusted using the sliders on the left side of the DAC interface. This allows you to explore each variable’s importance in forming clusters or patterns within the projected space (see the Sliders section). Values for the weights range between zero and one, with a value of zero excluding a variable, and a value of one providing full inclusion.
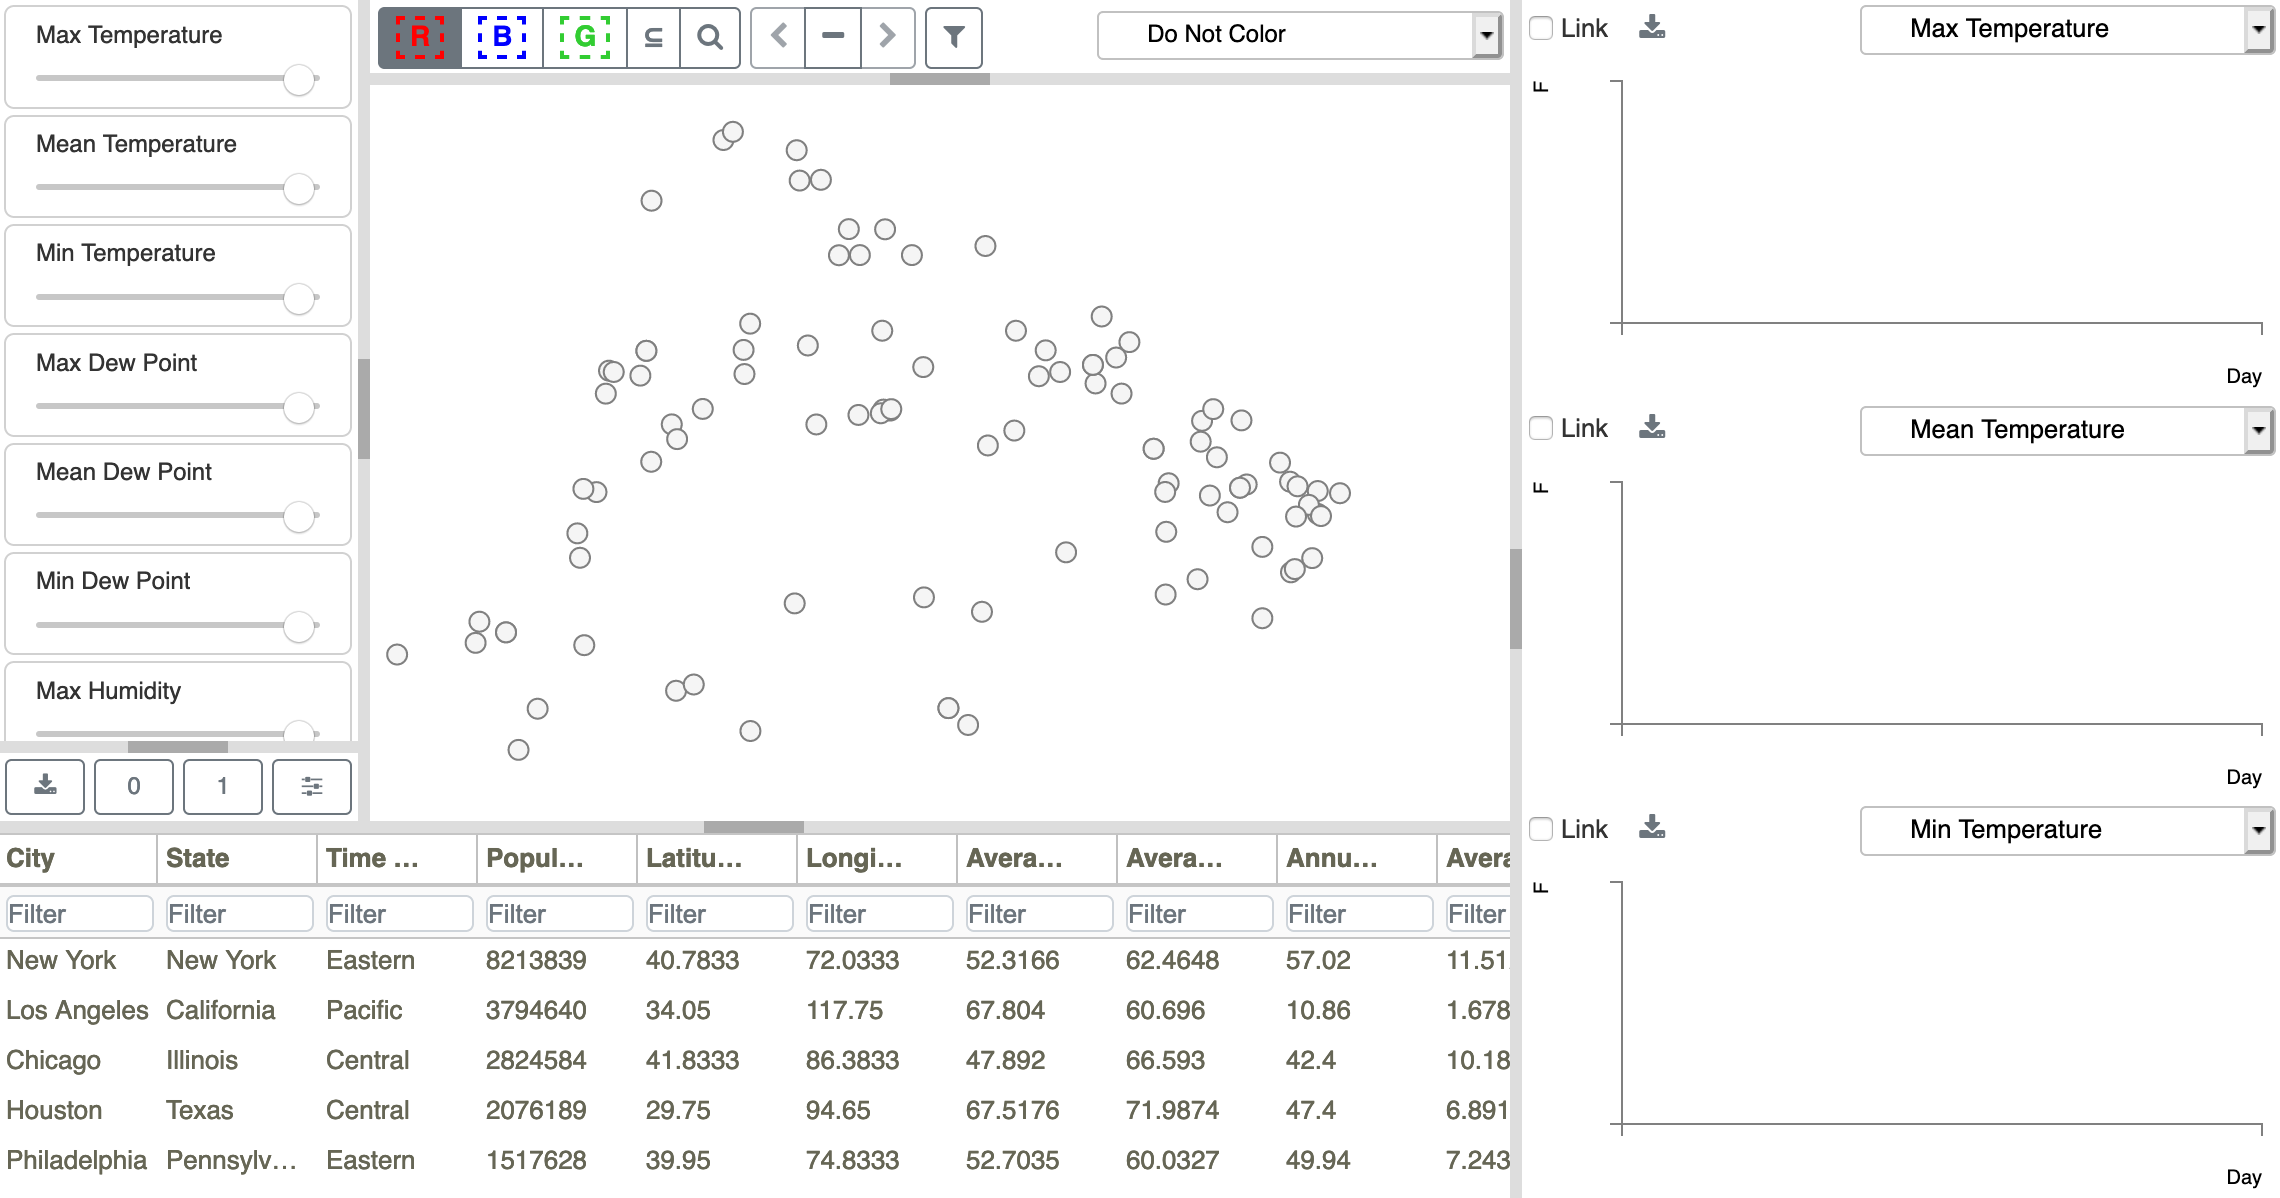
Figure 14: Initial DAC model configuration for the Weather Data.
Once processing is complete, Slycat™ will take you to a rendering of the new DAC model. The initial view of the Weather model is shown in Figure 14.