Sliders

Figure 17: Temporal variables and their associated sliders, with each variable’s slider set to a differing weight.
All the temporal variables in the data set are listed in the Slider view, shown in Figure 17. If the full list of temporal variables cannot fit within the view, scrolling will be enabled through a scrollbar on the right side of the list. Underneath each variable is a slider for setting that variable’s weight in the MDS calculation. Each slider independently sets the weight of the associated variable. Weights are valued between 0 and 1, with sliders positioned to the far left being set to 0, and sliders on the far right being set to 1. Hovering over a slider displays its actual value, also shown in Figure 17. Users interactively adjust a variable’s weight by dragging the slider, which then triggers changes to the positions of points in the Scatterplot.

Figure 18: Slider controls are (1) download table, (2) set all sliders to 0, (3) set all sliders to 1, and (4) optimize sliders for selected Metadata Table column.
The controls shown in Figure 18 appear at the bottom of the Slider view. From left to right, the buttons perform the following functions:
Download all (or part of) the Metadata Table as a CSV file to your local machine.
Set all slider weights to 0.
Set all slider weights to 1.
Set the slider weights to optimize the Scatterplot for the selected Metadata Table column (selected from the dropdown list in the upper right above the Scatterplot, as shown in Figure 20).
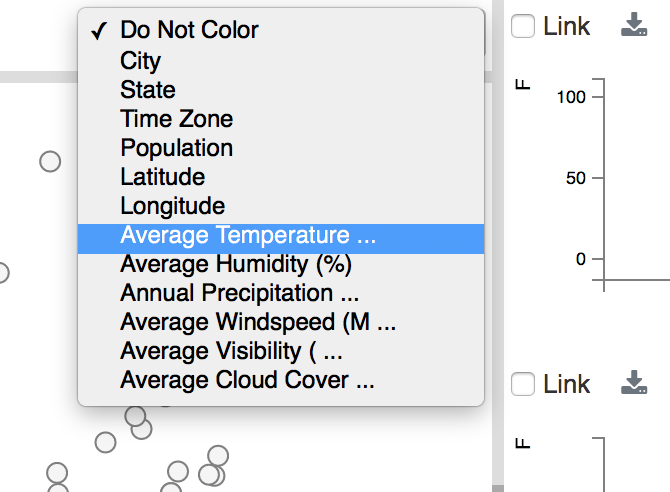
Figure 20: Weather data scalar variables for color-coding Scatterplot points. The default is ‘Do Not Color’.