Time Series Plots
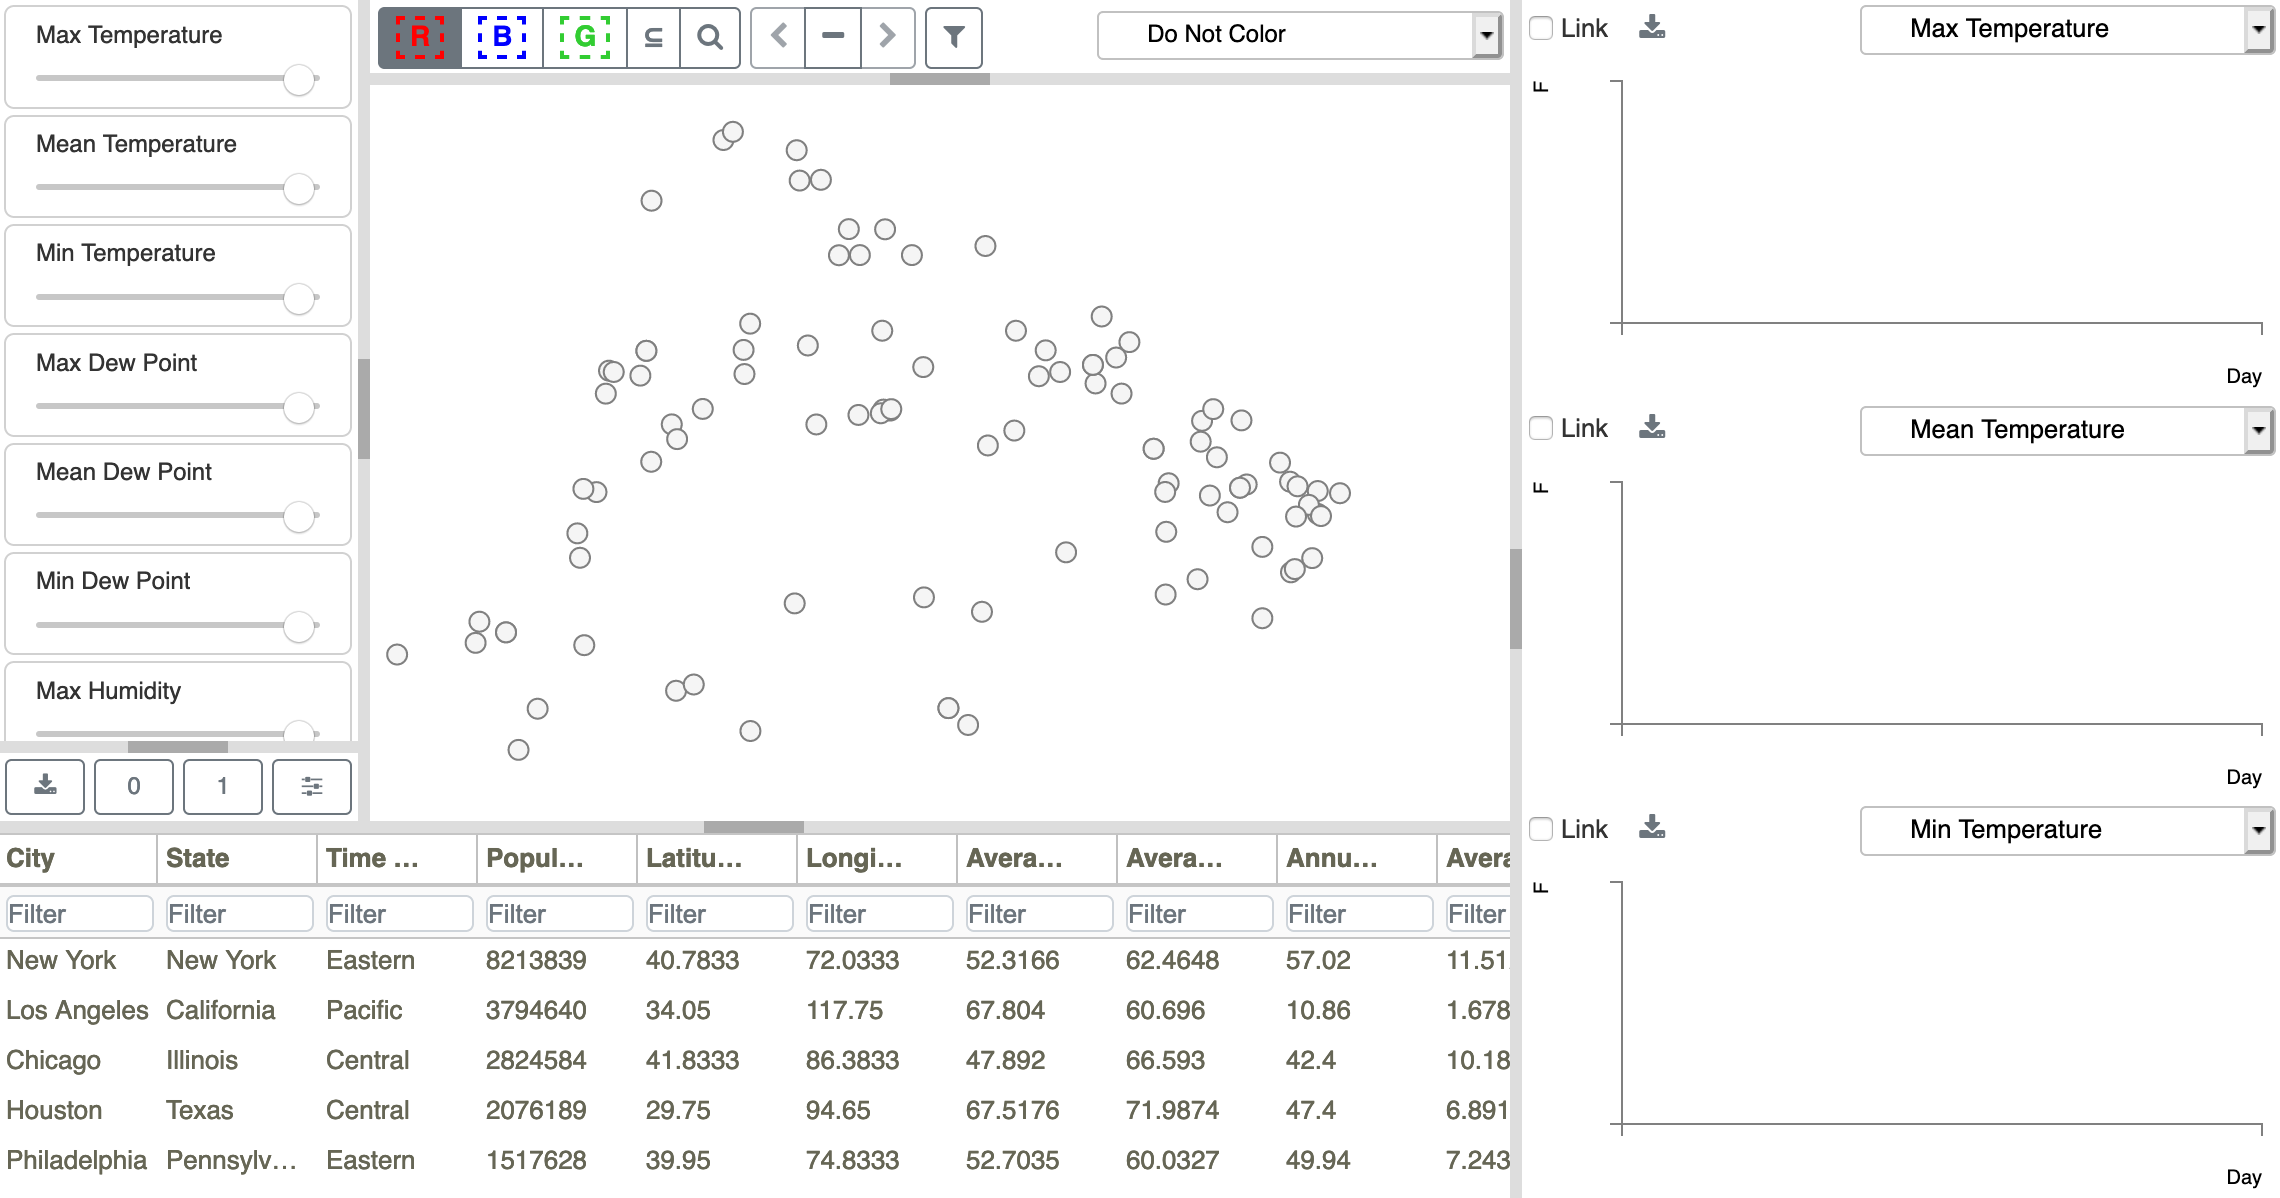
Figure 14: Initial DAC model configuration for the Weather Data.
As shown in Figure 14, the Time Series Plots are initially empty. Once point sets have been selected (see Selecting Point Sets ), plots of the first three temporal variables (as listed in the Sliders view) are generated for the selected points. An example plot is shown in Figure 30.
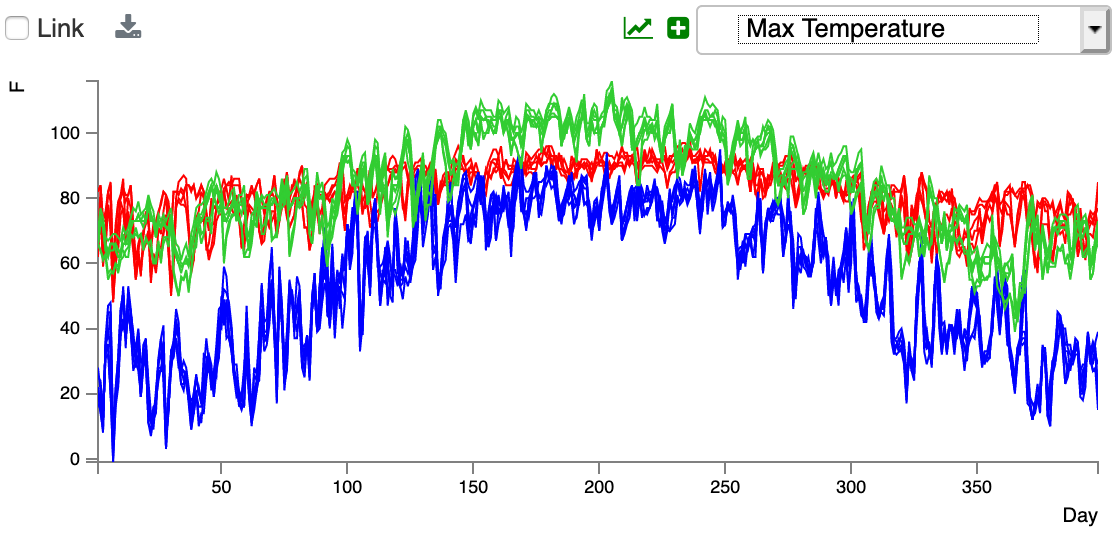
Figure 30: Max Temperature time series plots for selected city sets.