Plot Linking
In the upper left of each time series plot there is a Link checkbox. These checkboxes allow the user to perform the same operation on multiple plots simultaneously. For example, if the user links all three plots, then uses zoom in the first plot, each of the other plots will be zoomed to the same scale. In addition, a vertical line indicating the cursor position, normally shown in each individual plot, is duplicated on any linked plots. Two linked plots are shown in Figure 33.
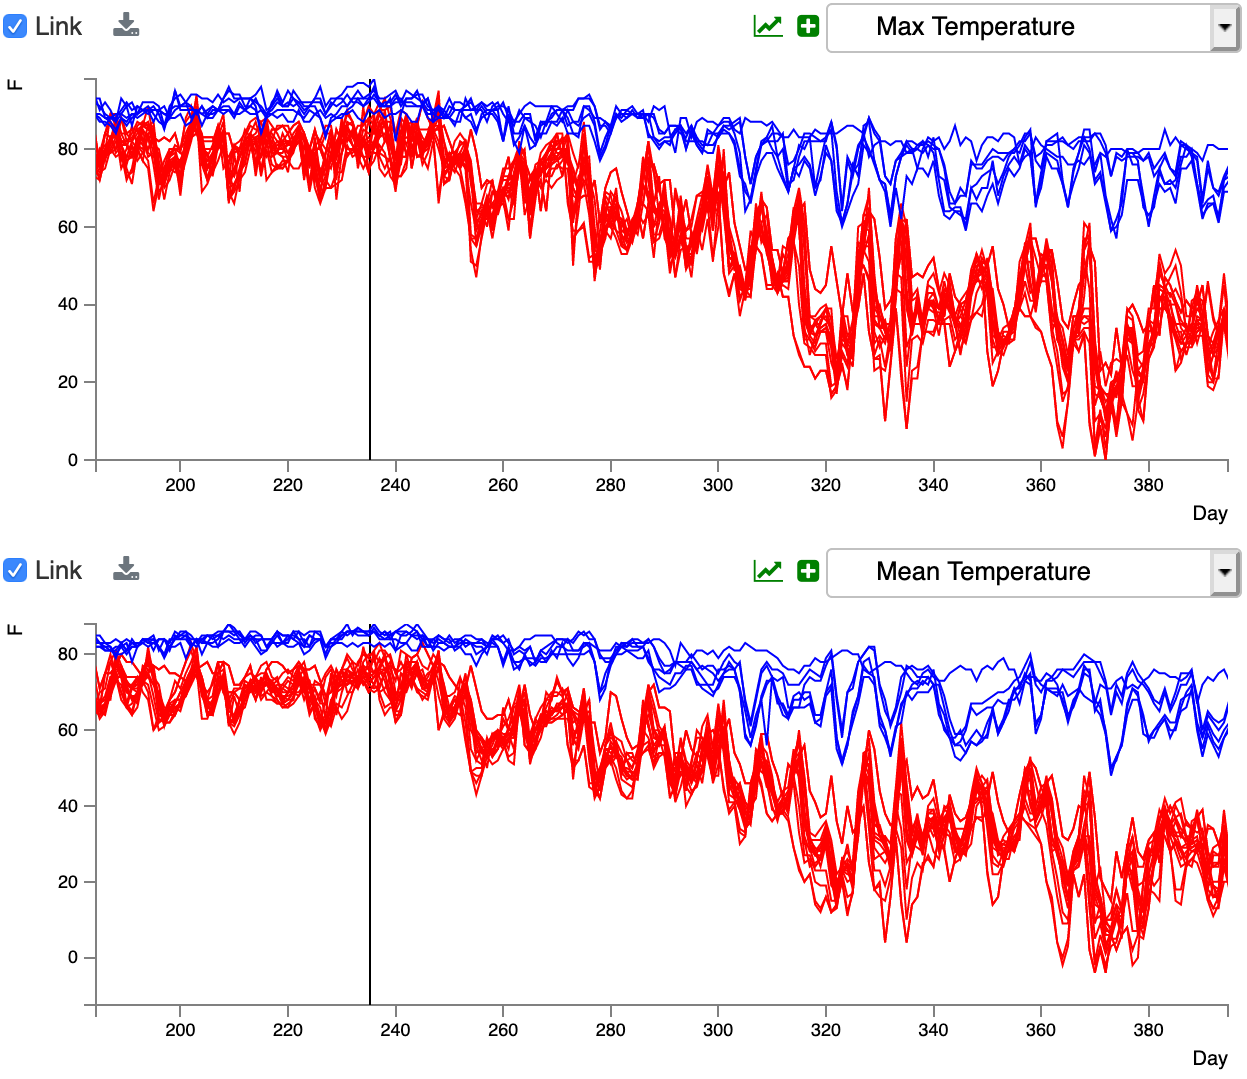
Figure 33: Linked plots, both zoomed to the same scale. The user’s cursor position is shown as a vertical line, replicated in both linked plots.
In order to link plots, the time scale (x-axis) must be identical in the plots to be linked. If the scales are not identical, an error message will be displayed, and the plots will not be linked.