Download Plot Data 
Immediately to the right of the Link check boxes, there are download buttons for each time series plot. For each plot, this
button can be used to export the actual (x,y) values in the time series plots displayed. The resulting dialog is shown in Figure 34.
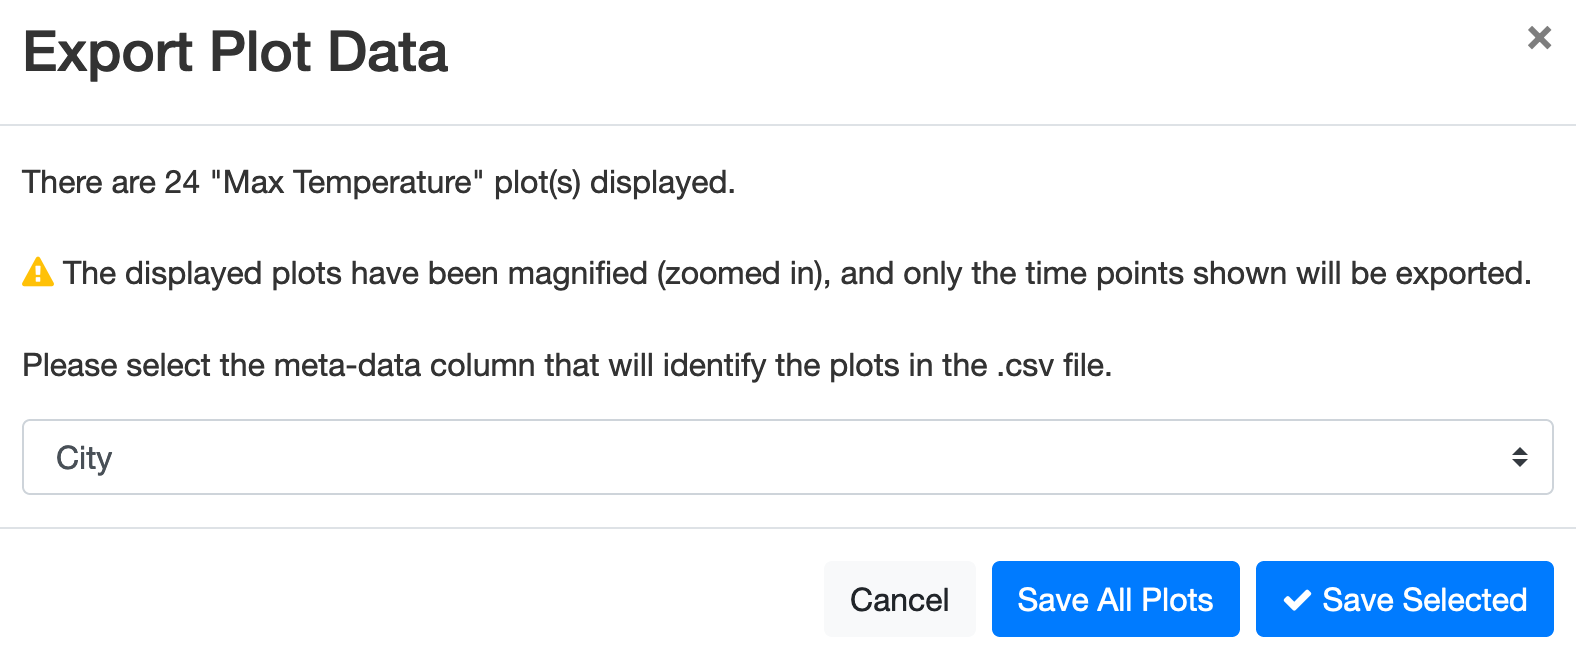
Figure 34: Exporting plot data dialog.
Plot data is exported as a CSV formatted file, and the user must select a Metadata Table column to use for identification of the plot in the header row. The default label is the first column in the Metadata Table. Additionally, there are a couple of caveats. First, if the plot scale has been zoomed, only the time points shown in the plot will be exported. If you want all time points exported, you will have to close the dialog, reset the zoom, and push the export plot button again. Second, if the plots have been filtered (see Filter Plots and Table Filtering), then only the plots displayed (selected and filtered) will be exported. If you want to export non-filtered plots you will have to close the dialog, clear the filters and push the export plot button again. These caveats apply to both the “Save All Plots” button and the “Save Selected” button. In both cases you are saving only what is displayed in the Time Series Plots display.