Options
The final dialog in the Model Preferences wizard allows the user to adjust performance-oriented parameters. It is shown in Figure 55. The first adjustable parameter is the “Max. label length,” an integer which specifies how long variable names can be before they are truncated to prevent pulldown menus from being overly wide. The default value is 20. Names longer than 20 characters are truncated with an appended ellipsis (e.g. “Mean Sea Level Press …” instead of “Mean Sea Level Pressure”).
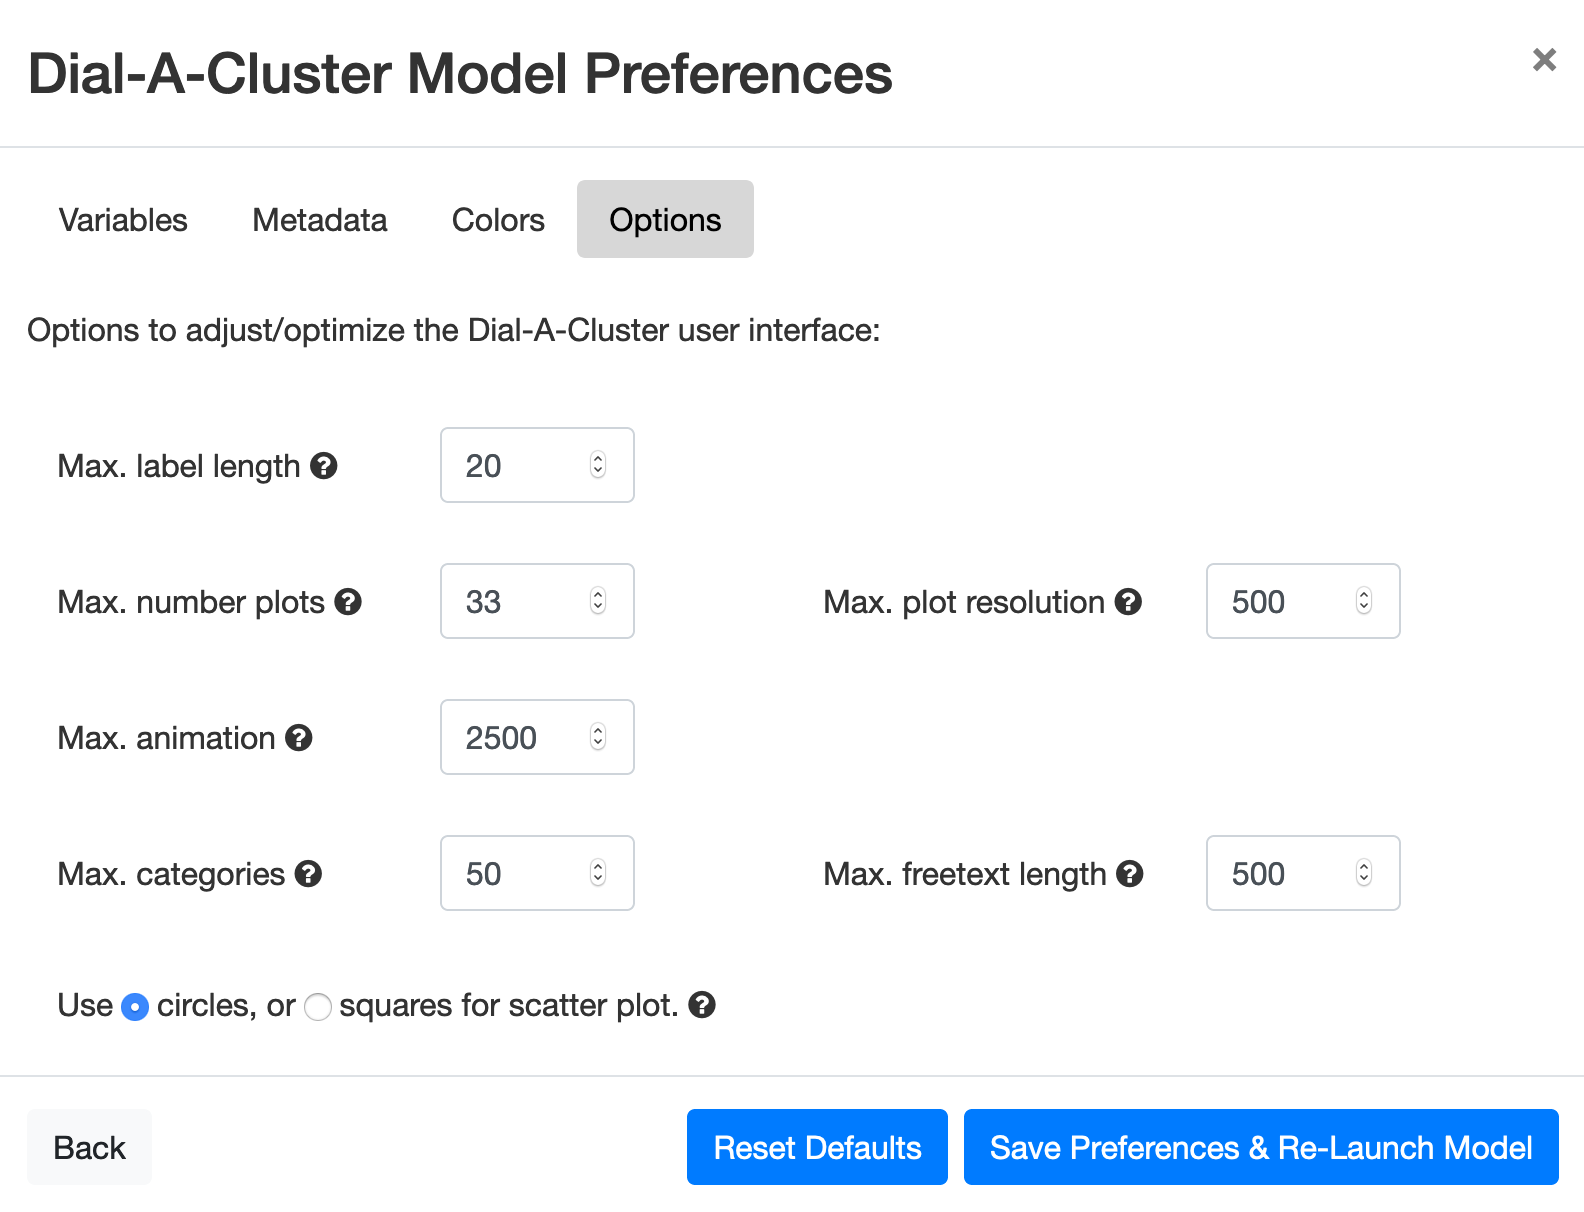
Figure 55: Performance-oriented parameters available to modify in the Model Preferences wizard.
The second adjustable parameter is “Max. number plots,” which specifies the maximum number of Time Series Plots to
display per variable. The default value for this parameter is 33. This allows the user to make arbitrarily large
selections but will only plot a random subset of the corresponding plots. This is necessary to prevent performance
delays from rendering too many plots. A smaller number for the maximum number of plots will result in a faster user
interface experience and a larger number will result in a slower user interface experience. In case the maximum number
of plots is exceeded in the selection, an indicator  will be displayed warning that you are not viewing
all the plots in the selection (see Plot Resolution Indicators for details).
will be displayed warning that you are not viewing
all the plots in the selection (see Plot Resolution Indicators for details).
The third adjustable parameter is “Max. plot resolution,” also related to the Time Series Plots. The maximum plot
resolution specifies how many time points to use when rendering the Time Series Plots. The default number is 500.
This is again necessary to prevent performance delays due to browser rendering speed. For a faster user interface
experience, use a lower maximum plot resolution. There is a corresponding indicator  which is displayed
when the plot resolution exceeds the maximum specified (see again Plot Resolution Indicators for details).
which is displayed
when the plot resolution exceeds the maximum specified (see again Plot Resolution Indicators for details).
The fourth adjustable parameter is “Max. animation.” This integer that defaults to 2,500 and determines the maximum number of points in the Scatterplot beyond which changes in the coordinates are no longer animated. If animation during zooming, sub-setting, or adjusting the sliders in the Sliders pane is jumpy and/or too slow, this parameter can be lowered to avoid animation between the old and new coordinates.
The fifth parameter “Max. categories” specifies the maximum number of categories allowed in a user-added categorical column in the Metadata Table. See Adding Table Columns. The sixth parameter “Max. freetext length” is also related to the Metadata Table user-added columns. The maximum freetext length specifies the maximum of characters allowed for notes input into the text box of a freetext user-added column.
Finally, the DAC user interface allows the use of squares to represent points in the Scatterplot. This option can be
specified by switching between the radio buttons in “Use  circles, or
  squares for
scatter plot.” The option is included to improve rendering speed for the Scatterplot in the browser, as squares are
rendered more quickly than circles.
squares for
scatter plot.” The option is included to improve rendering speed for the Scatterplot in the browser, as squares are
rendered more quickly than circles.