Table Columns
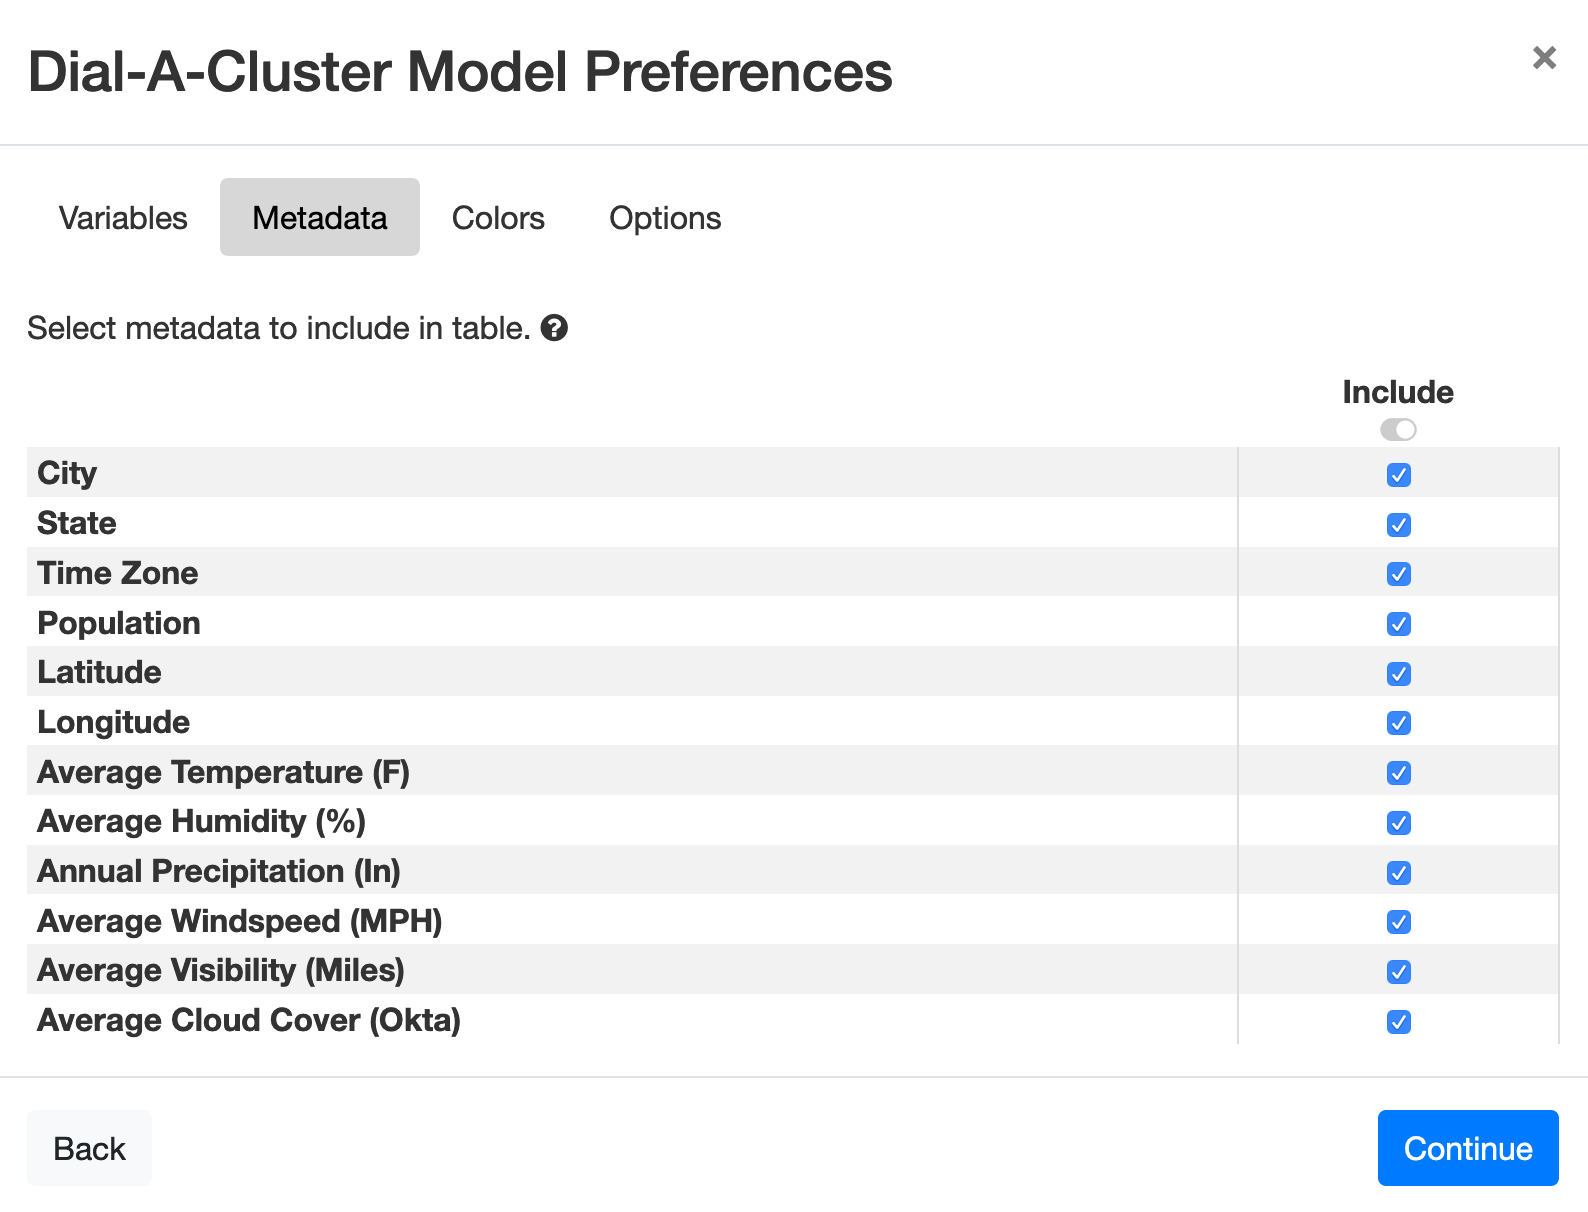
Figure 51: Selecting table columns to display in the Metadata Table.
In addition to selecting variables to display in the Sliders pane and Time Series Plots, you can also select the columns in the Metadata Table that you would like to display. The dialog for selecting columns in the Metadata Table is shown in Figure 51. By hiding columns, you can create a smaller metadata table. The hidden columns will also be unseen in the color selection pulldown above the Scatterplot (see Figure 20 below).
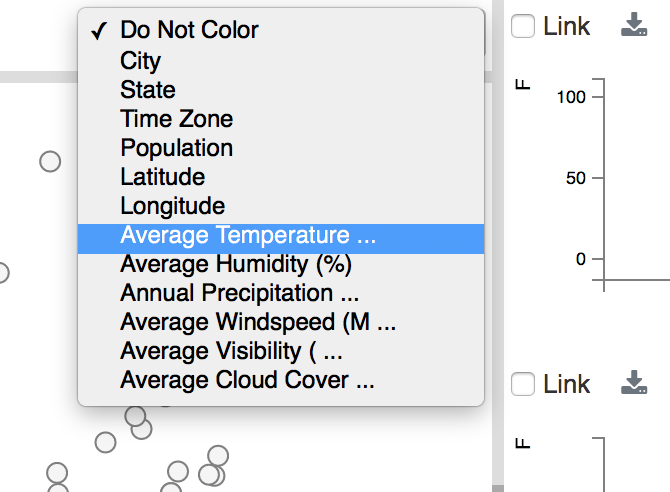
Figure 20: Weather data scalar variables for color-coding Scatterplot points. The default is ‘Do Not Color’.
As in the case of hidden variables, columns are not in fact removed from the model. They are only hidden to provide a less cumbersome interface. By revisiting the column selection dialog, you can re-display columns that were previously hidden. Once the desired columns to display are selected, press the Continue button.