Dendrogram View
The Dendrogram View displays a tree that clusters line plots from a single temporal variable by similarity. The analysis begins by calculating distances between each pair of time series vectors, an O(n2) calculation. Then the distance matrix is used to build the dendrogram using agglomerative clustering. Each time series output variable generates a different tree.
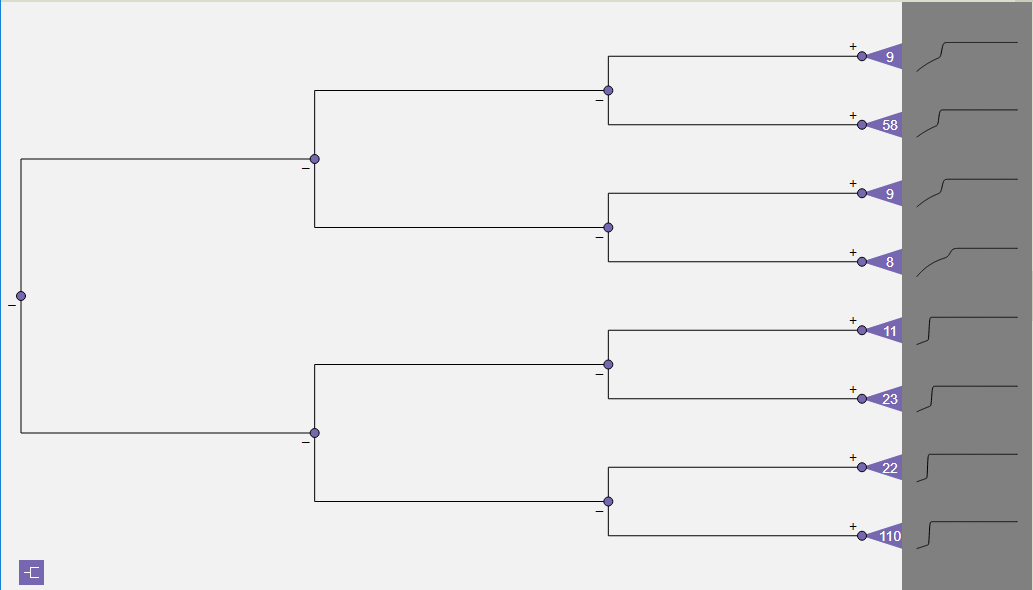
Figure 56: Dendrogram tree level compression.
The dendrogram is drawn with the root on the left and the leaves on the right. To reduce visual clutter, the tree is not drawn at full resolution at every level down to the leaves. Instead, only the first four levels of the tree are initially rendered (as shown in Figure 56), with the last level on the right consisting of collapsed subtrees for the remaining sections of the tree down to the leaves. The subtrees are represented by purple triangular icons, each labeled with the number of nodes in its subtree. Non-collapsed nodes in the tree are drawn as purple dots.