Time Series Simulation View
The Simulation View is a line plot, where each line represents an ensemble member. The X axis is the shared range of temporal values between simulations, and the Y axis is the time series variable value. The lines are color-coded by using the value of a selected scalar variable (see Color-Coding Lines) to potentially reveal correlations between inputs and groups of similar output plots, as demonstrated by the examples of the previous section.
Line visibility in the Simulation View is controlled by selecting nodes and subtrees within the dendrogram (see Dendrogram View). Moving the mouse over the line plots, Slycat™ interactively provides feedback showing which line is being pointed at through a combination of highlighting the focus line and dimming all the other lines. Left-clicking on the line selects the simulation in all views, highlighting the sparkline next to the associated subtree in the dendrogram, highlighting the line in the line plot, and highlighting the associated row in the table. Multiple lines can be selected using control-click to toggle the selection state of lines (i.e. holding the control key while clicking adds unselected lines to the selection set, or removes previously selected lines from the set). Control-click selection is available in all three views, operating on sparklines, line plots, or table rows. To clear the current set of selections, click in the background of the Simulation View in any area away from the lines.
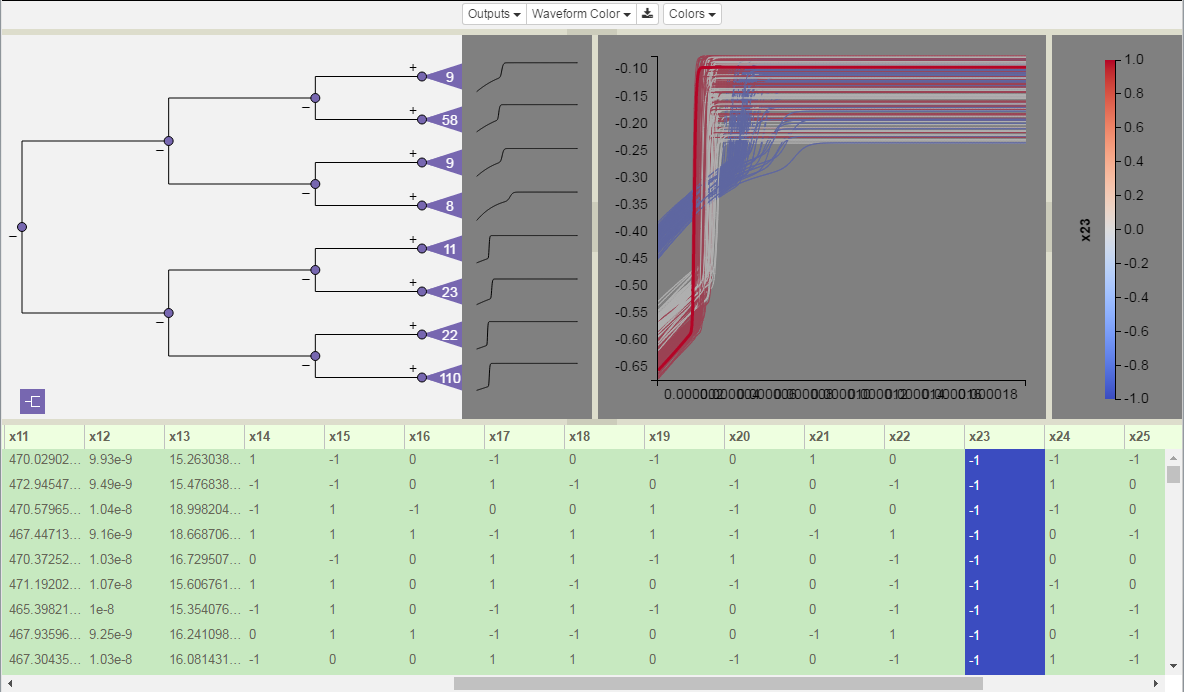
Time Series model with Simulation View in middle upper right, and Legend on the far right.
Color-Coding Lines
The first time a model is rendered, the lines are colored by their index number. There are two mechanisms for changing the variable selected for the color-coding: clicking on the column header in the Variable Table or selecting a variable from the Line Color dropdown list. Irrespective of the interface used, changing the color-mapping variable will lead to changes in all three views and the legend, including: recoloring the line plot using the new variable’s values, coloring the cell backgrounds in that variable’s table column, returning the cell backgrounds of the previously selected variable’s column to the default color (green, lavender, or white depending on whether the variable is an input, output, or neither), recoloring any sparklines that are leaf nodes in the dendrogram, and relabeling and redefining the value range in the Legend (see below).
Legend
To the right of the line plot is the Legend. The Legend is in its own view, which can be resized or closed altogether. The Legend displays information about the current color-coding variable, including its name, range of values, and the mapping between values and colors. The color palette is defined by the current theme (see Color Themes).