Time Series Model Visualization
Our examples in this section come from an ensemble of 250 electrical circuit simulations, where our time series outputs are current and voltage variables sampled over time. A Time Series model of this ensemble is shown in Figure 54. The model provides three linked views, each providing a different level of abstraction. The Dendrogram View in the upper left provides a high-level view that groups waveforms by similarity. In the upper right, the Simulation View displays a line plot for each ensemble member. The plots are superimposed in a shared coordinate space to facilitate comparisons. The lowest level view is the Variable Table, which provides the raw data values from the original table file. It is drawn across the bottom of the display and may be scrolled both vertically and horizontally if the number of rows or columns exceeds the available space. Although the Variable Table may contain columns with scalar output metrics, or columns of file URIs that would be categorized as being neither input nor output, the ingestion wizard assumes all table columns are inputs and colors them green.
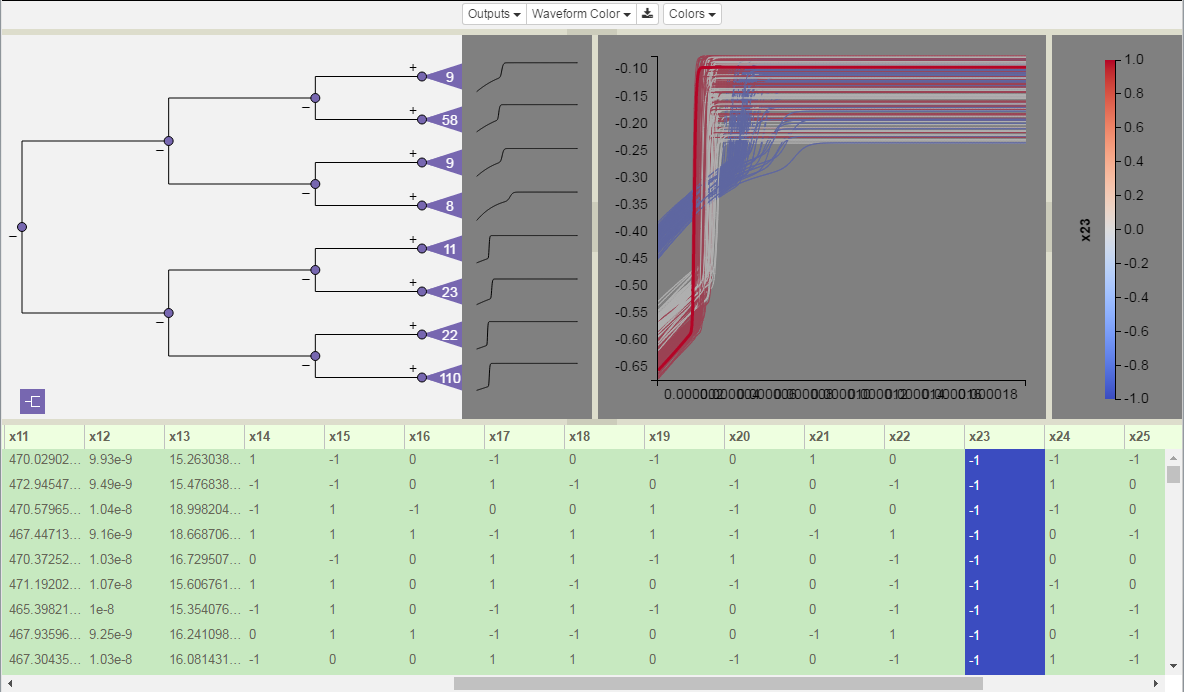
Figure 54: Time Series model with Dendrogram View in upper left, Simulation View in upper right, and Variable Table below.
The Dendrogram View controls visibility of ensemble members in both the Simulation View and the Variable Table. Selections can be made in any one of the views, after which they are propagated to the other two. Color-encoding is shared by all views.
The model specific controls for a Time Series model are shown in Figure 55. Within each time series file, multiple output variables may be present. Each variable is input as a column of values, and each row provides the values for all variables at a single instant in time. Each time series variable generates a distinctly different dendrogram and has a set of unique plots. The Outputs dropdown provides a list of the time series variables so you can select which one is currently being displayed in the Dendrogram View and the Simulation View.
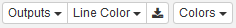
Figure 55: Time Series model specific controls. The Outputs dropdown switches the views between different time series variables. Line Color selects from the scalar input variables for color-coding the lines. The Download Table icon enables download of the entire Variable Table or subsets thereof. Colors selects the color theme. The latter two functions are shared by all model types.
To facilitate discovering relationships between input parameters and groups of output plots, it is often useful to color-code the lines by input variable values. Select a color-coding variable either through the Line Color dropdown or by clicking on a table column header (see Color-Coding Lines below).