Table Focus Selection
The Metadata Table allows a focus selection, similar to the focus selection available for the Scatterplot (Point Focus Selection) and the Time Series Plots (Plot Focus Selection). To bring an ensemble member into focus selection, simply click on the row of interest in the Metadata Table. If that row is a member of one of the colored selection sets, it will be highlighted in black with a black outline, the corresponding point in the Scatterplot will be highlighted in black, and the corresponding plot in the Time Series Plot will be drawn in black. If that row is not a member of one of the colored selections, the row will not be highlighted in black, but will still be shown using a black outline. Any table rows not in the current subset (see Subset Analysis ) will not be available for focus selection. A focus selection is shown in Figure 36.
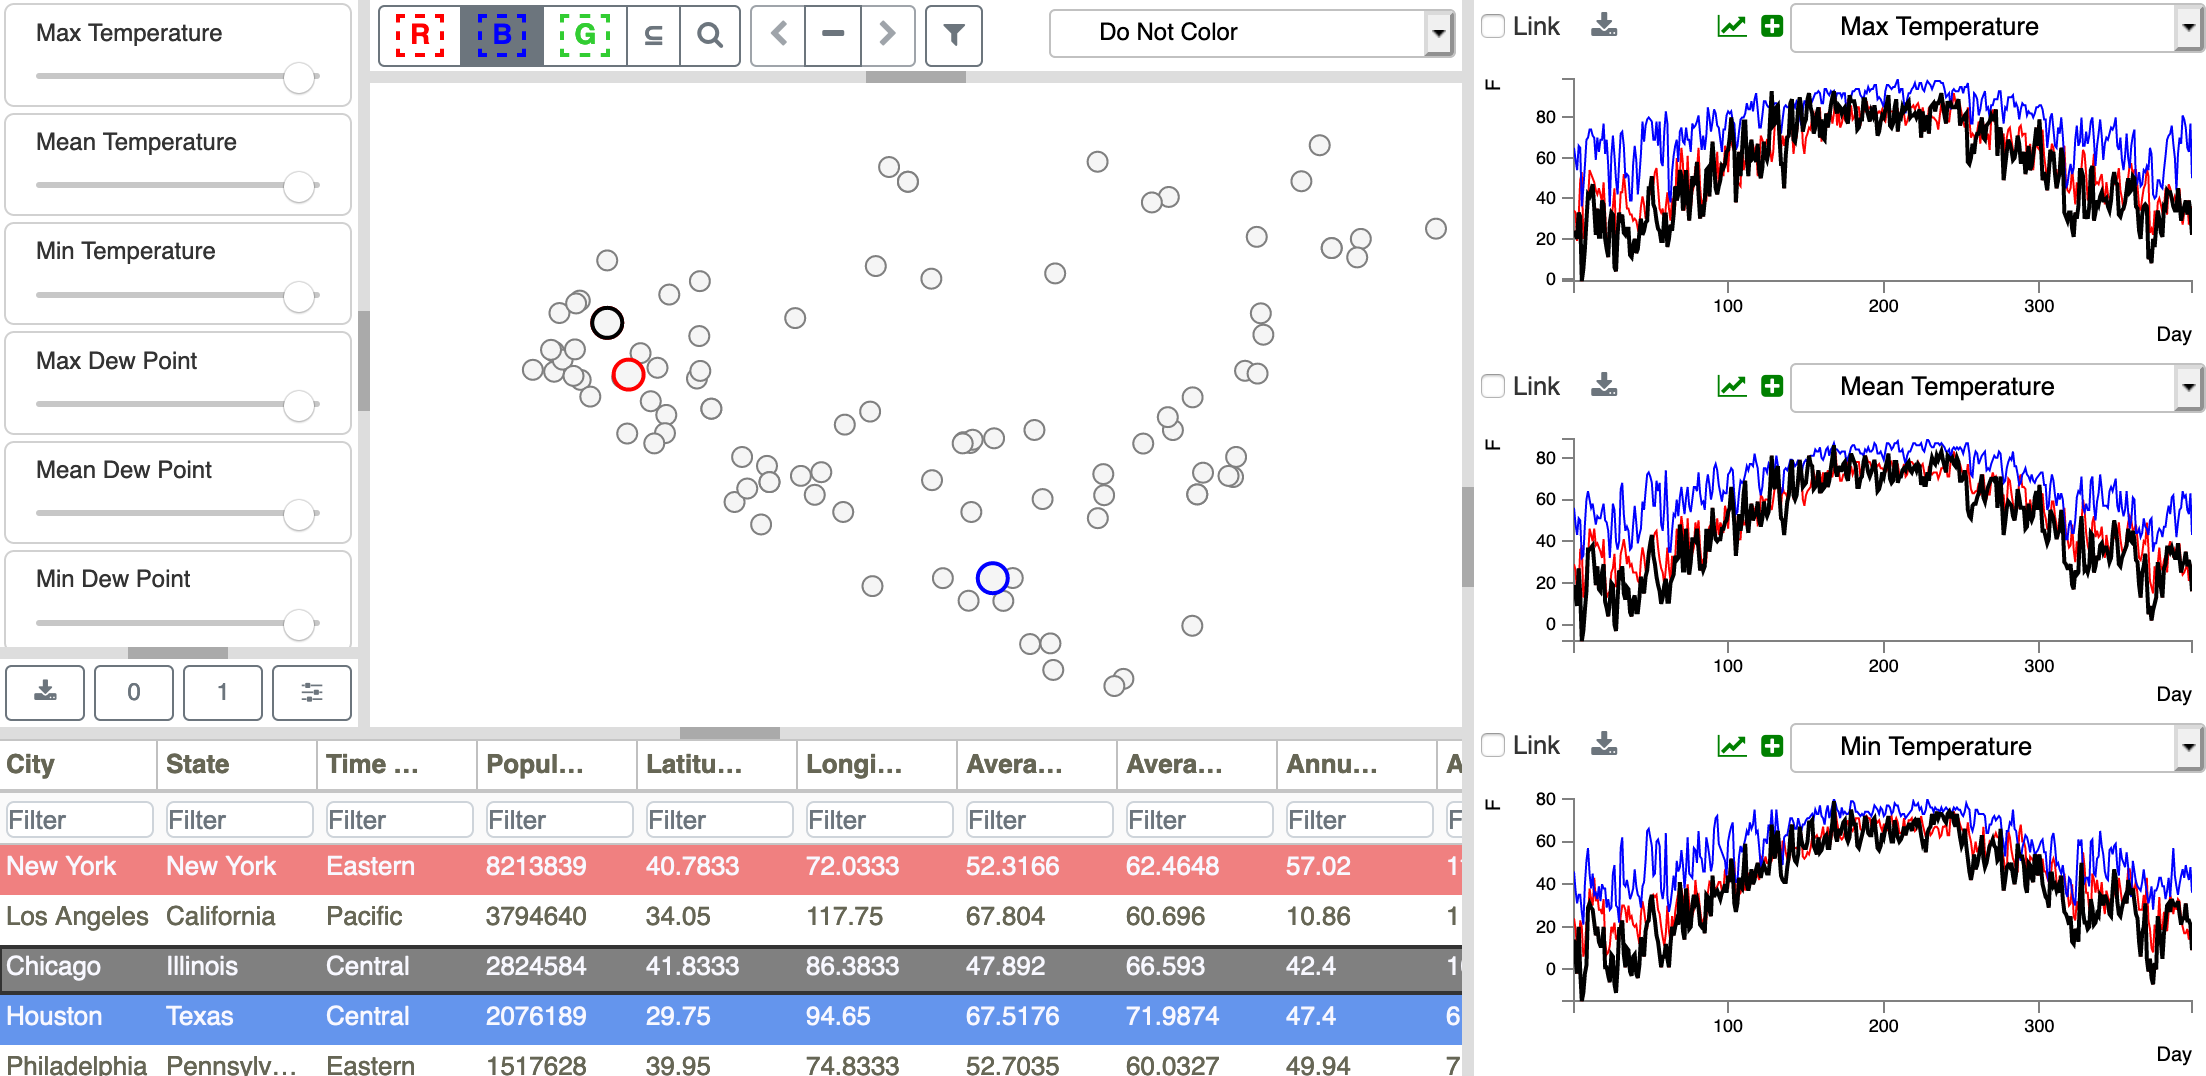
Figure 36: Focus selections are shown in black in the Metadata Table. Corresponding points in the Scatterplot and corresponding plots in the Time Series Plots are also shown in black.